
Global Fleet Platform
Fleet management, compliance, safety.

70Mil/H
65



700 m
Turn South to Potsdam's St.
63
m/h
65

01
Design Proccess
We designed a user experience with a simple, intuitive flow that aligned with user expectations, ensuring a clear product vision at this stage.
Define
Understanding product and goals
/01
Discovery
Analysis & Research, Personas, User Flow
/02
Design
Wireframe, Interaction, Testing, Prototype
/03
Deliver
UI Design, UI QA, Motion, Design System
/04
Typography & Colors
Roboto
The typography is based on a simple selection of Google web fonts, specifically the Roboto font family, to uphold the legacy of the previous brand style, implemented through the design system's tokens.
Aa Bb Cc
RegularMediumBold
12px — 56px
Primary
HEX #2F80EDRGB 47 126 237
Secondary
HEX #323A3CRGB 124 131 134
Background
HEX #FFFFFFRGB 245 245 245
White
HEX #FFFFFFRGB 245 245 245

Gradient Accent
HEX #32255ERGB 124 131 134
Extra
HEX #1DBD55RGB 29 189 85
02
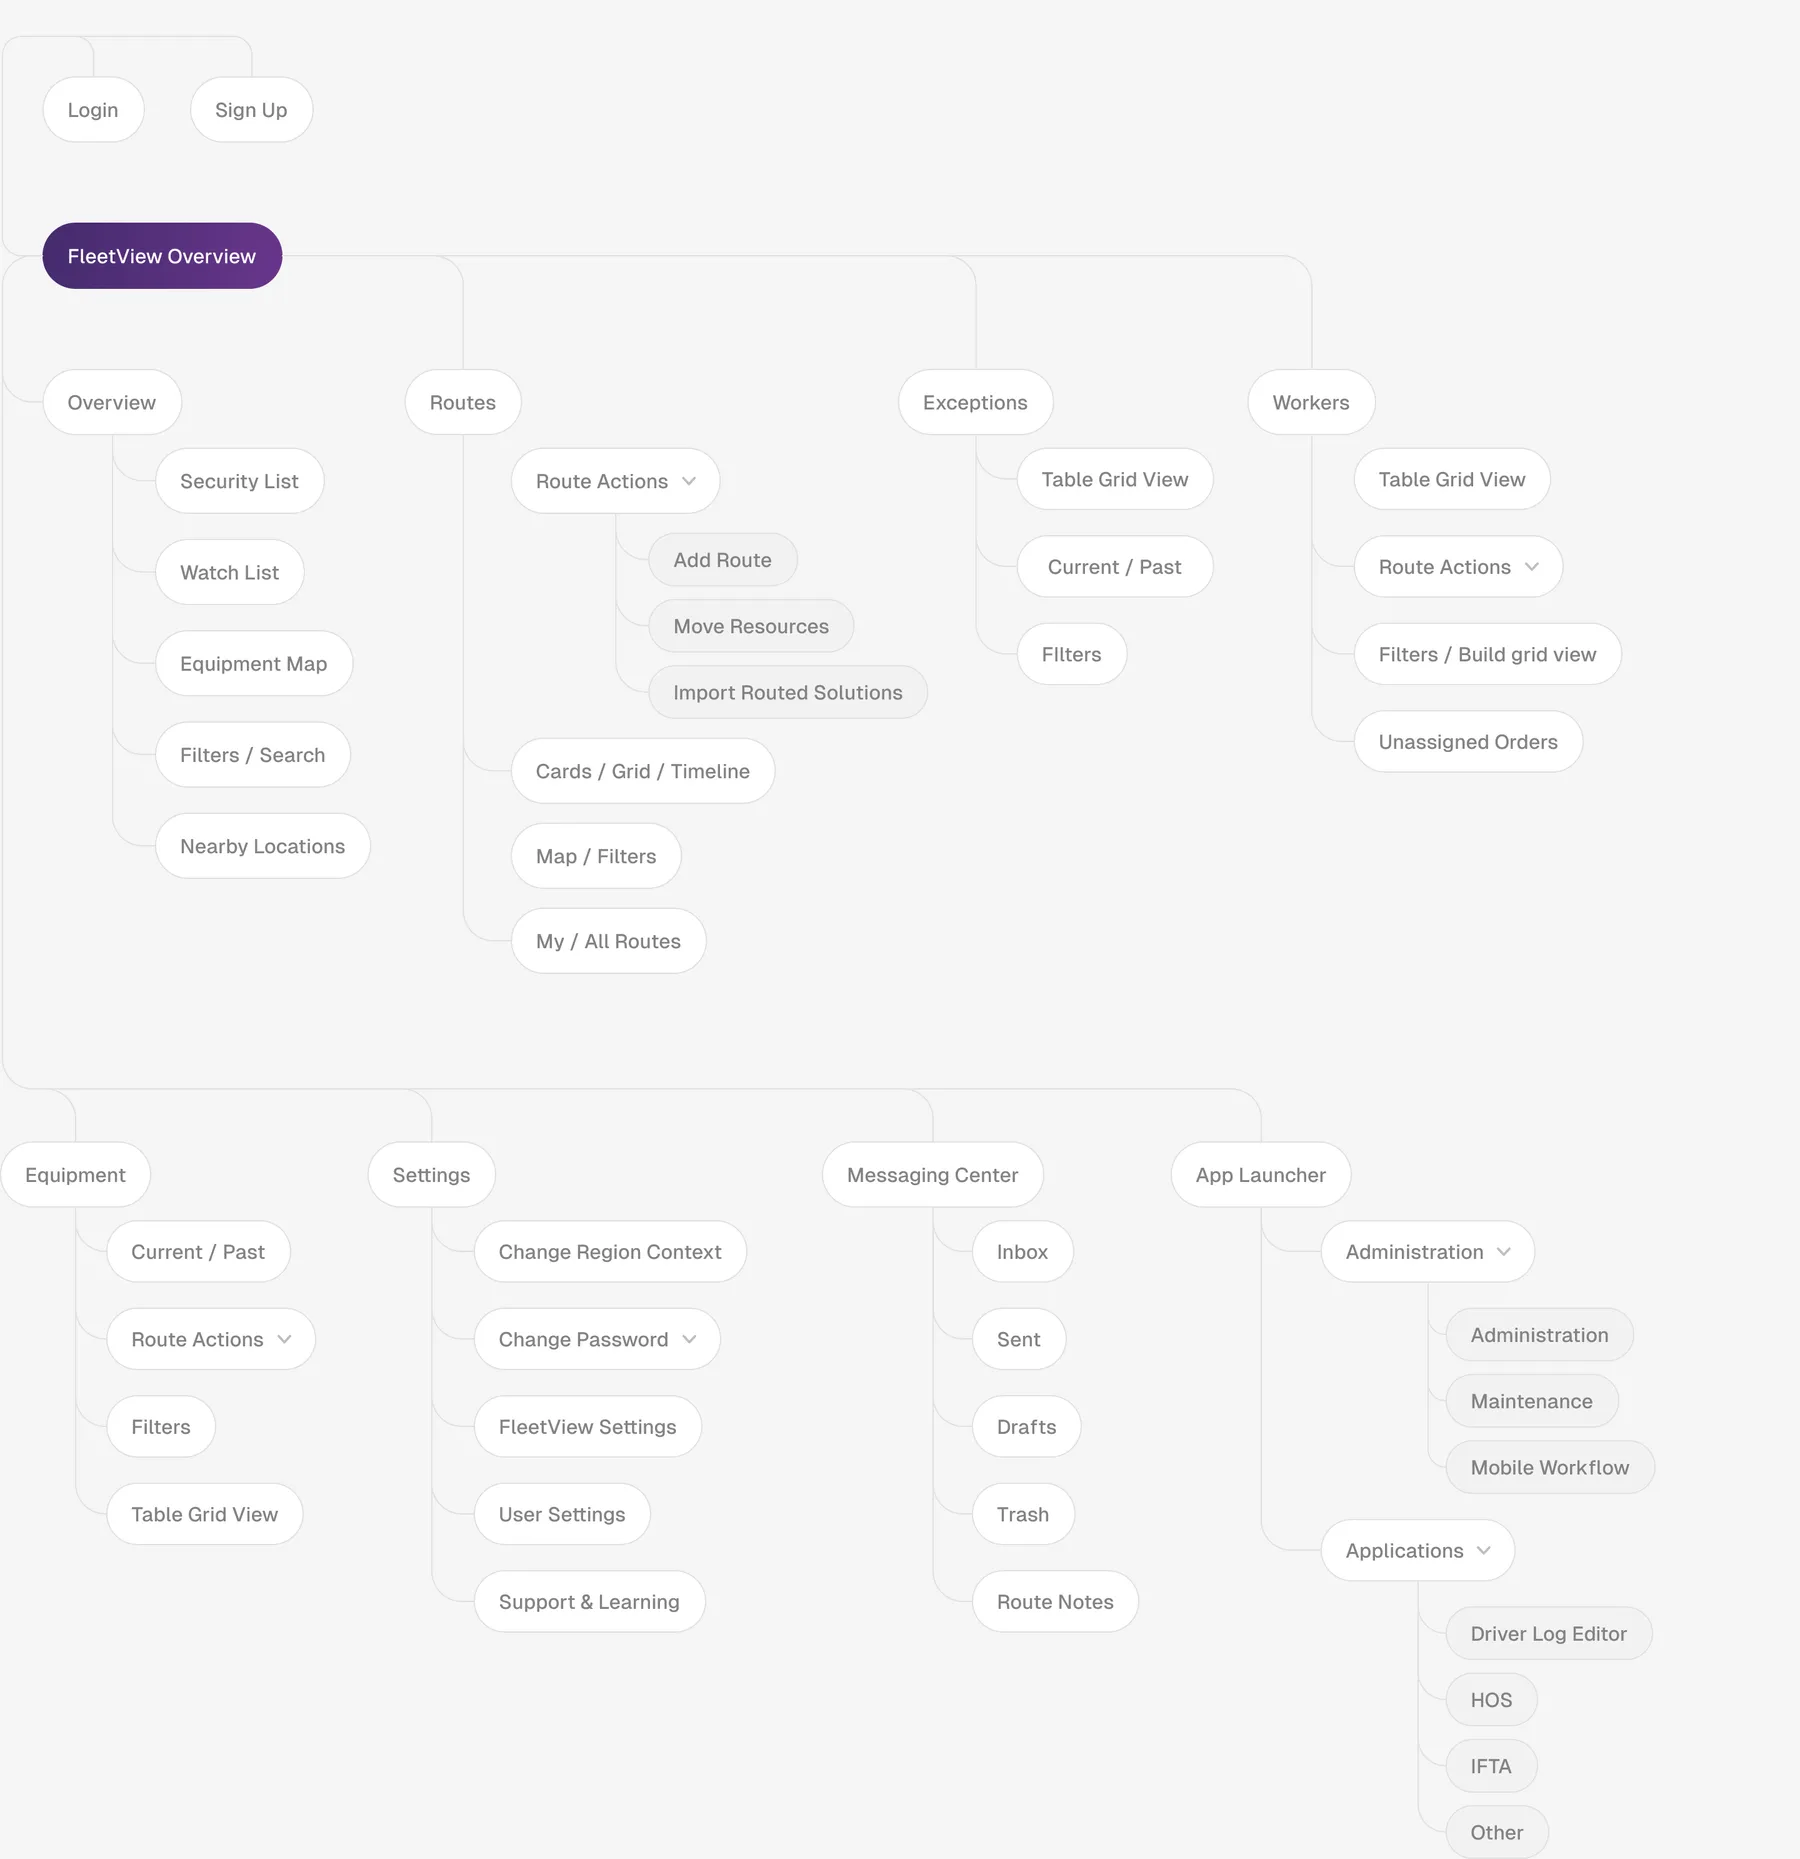
IA, Navigation,
Application Flow
The Application Map and User Flow provided users with a clear, structured path through the app, enhancing usability by simplifying navigation and ensuring an intuitive experience. It reflects the understanding how to interact with the app and get the most features.
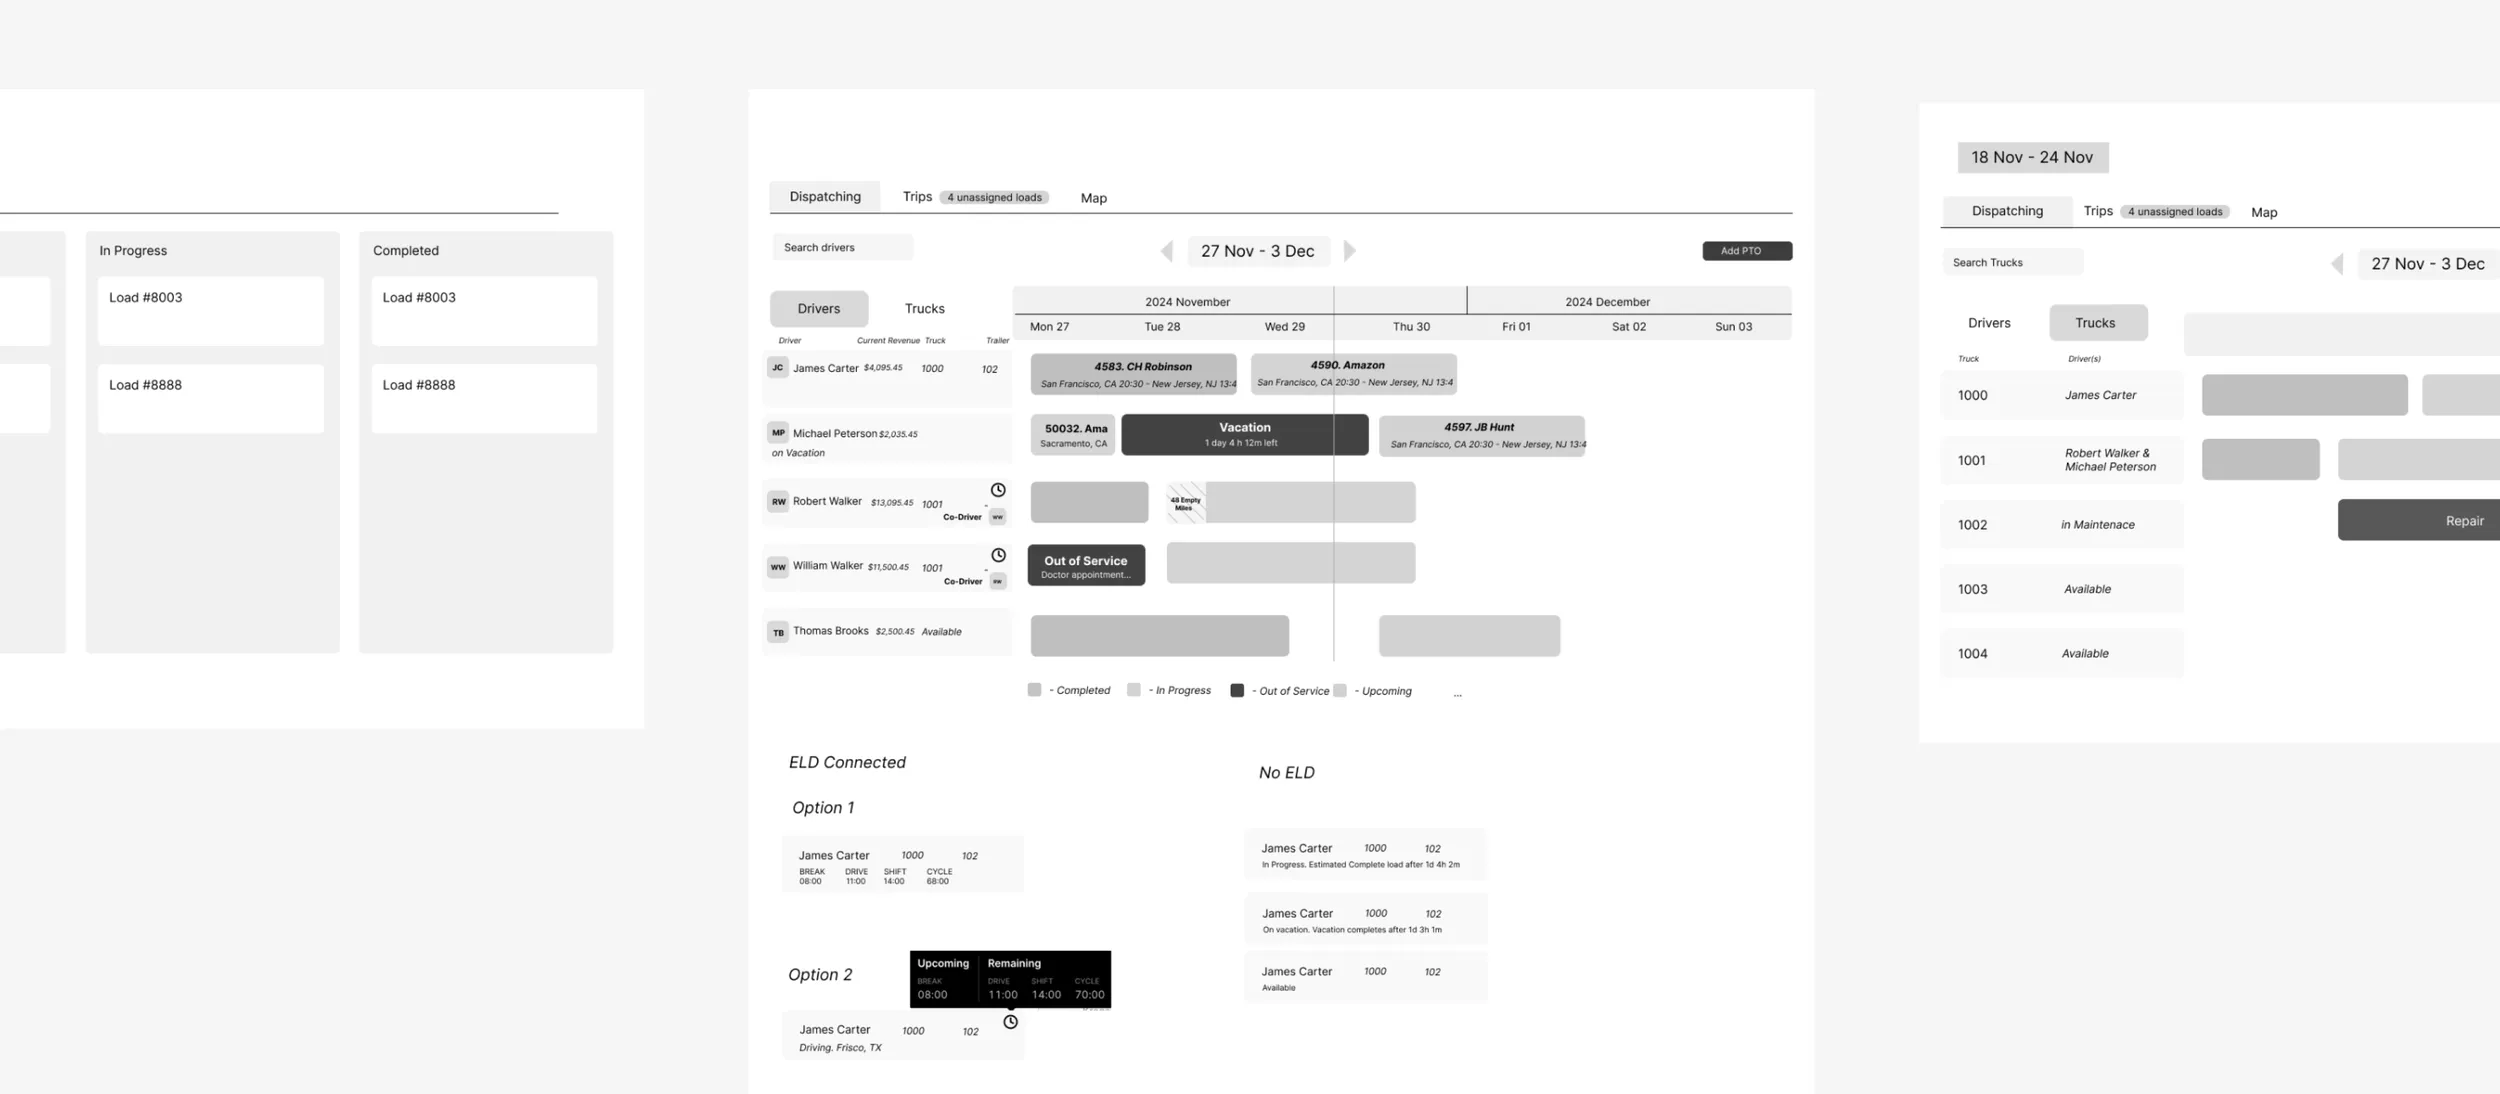
Wireframes
A wireframe showcasing an overview dashboard with the following elements:
- A board displaying loads and their statuses.
- A timeline of loads for easy tracking and scheduling.
- A section for drivers and truck deliveries, highlighting key details such as driver names, truck statuses, and alerts.
Additionally, the wireframe includes a feature for assigning drivers to specific vehicles, complete with options to specify shifts and availability.
03
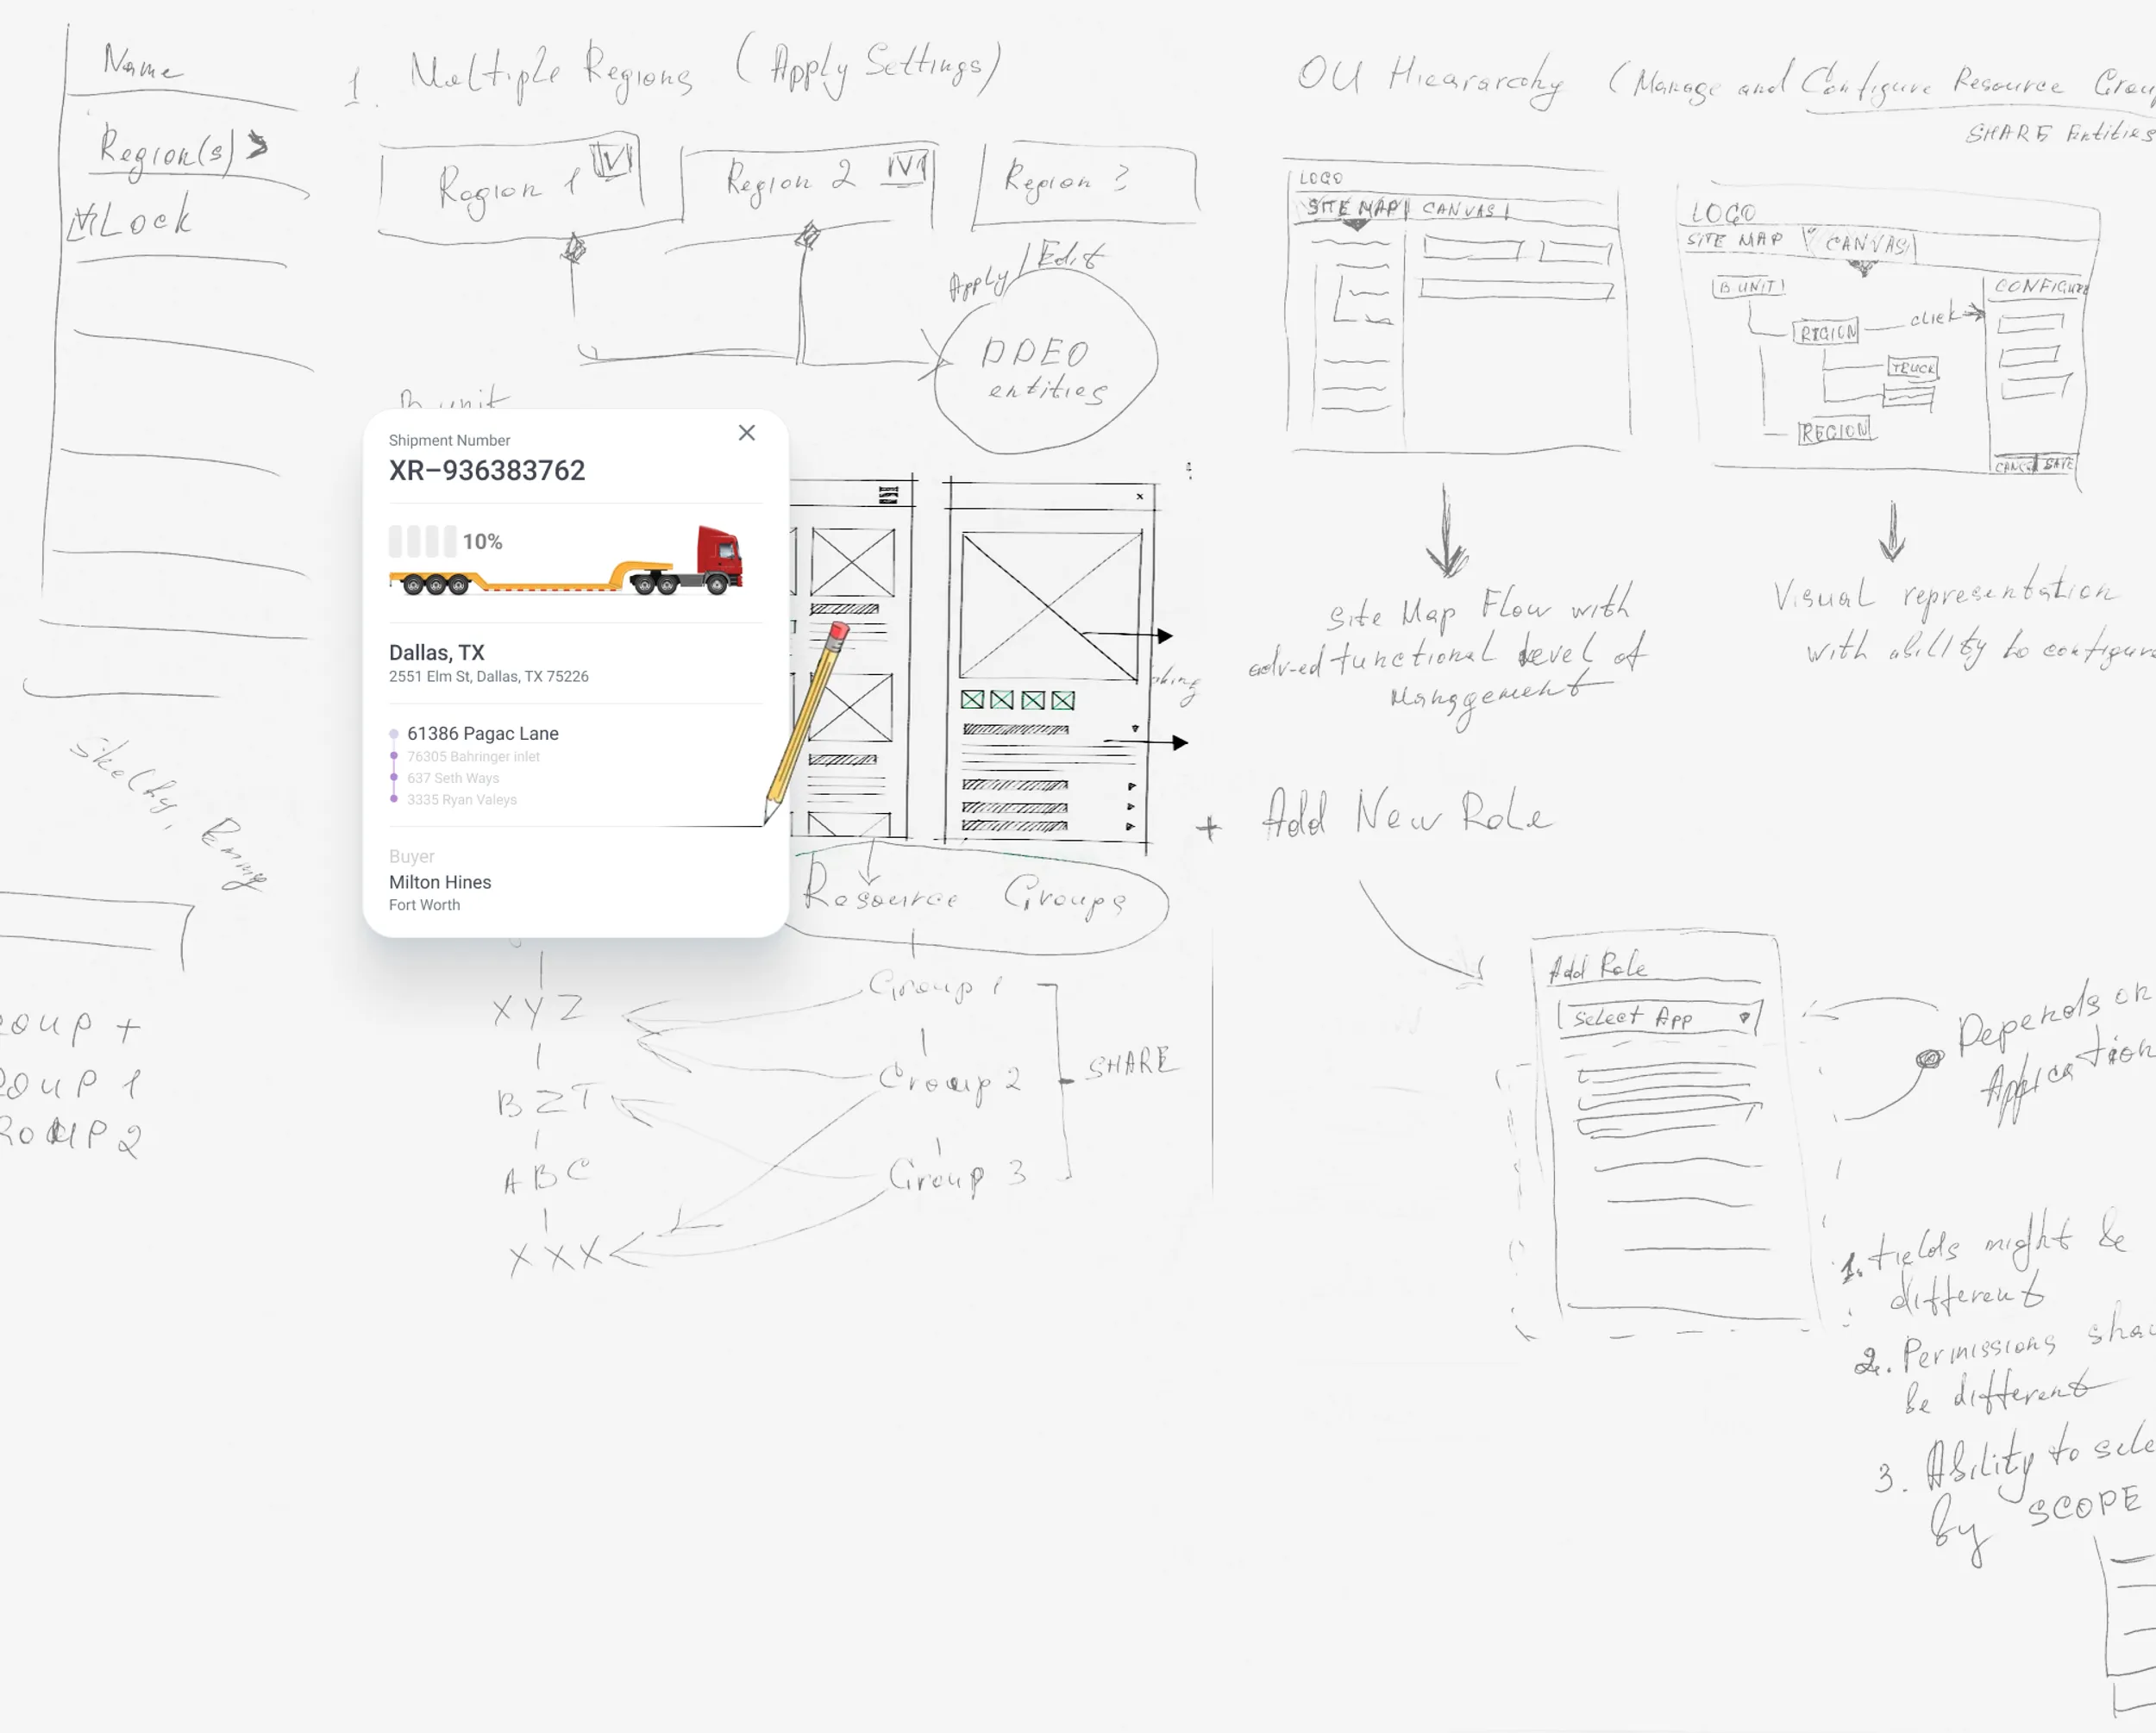
Ideation & Sketching
Ideation generates a range of creative solutions, while sketches quickly visualize ideas, allowing rapid iteration and refinement. This process ensures user needs and business goals are addressed early, before progressing to detailed wireframes or prototypes.
04
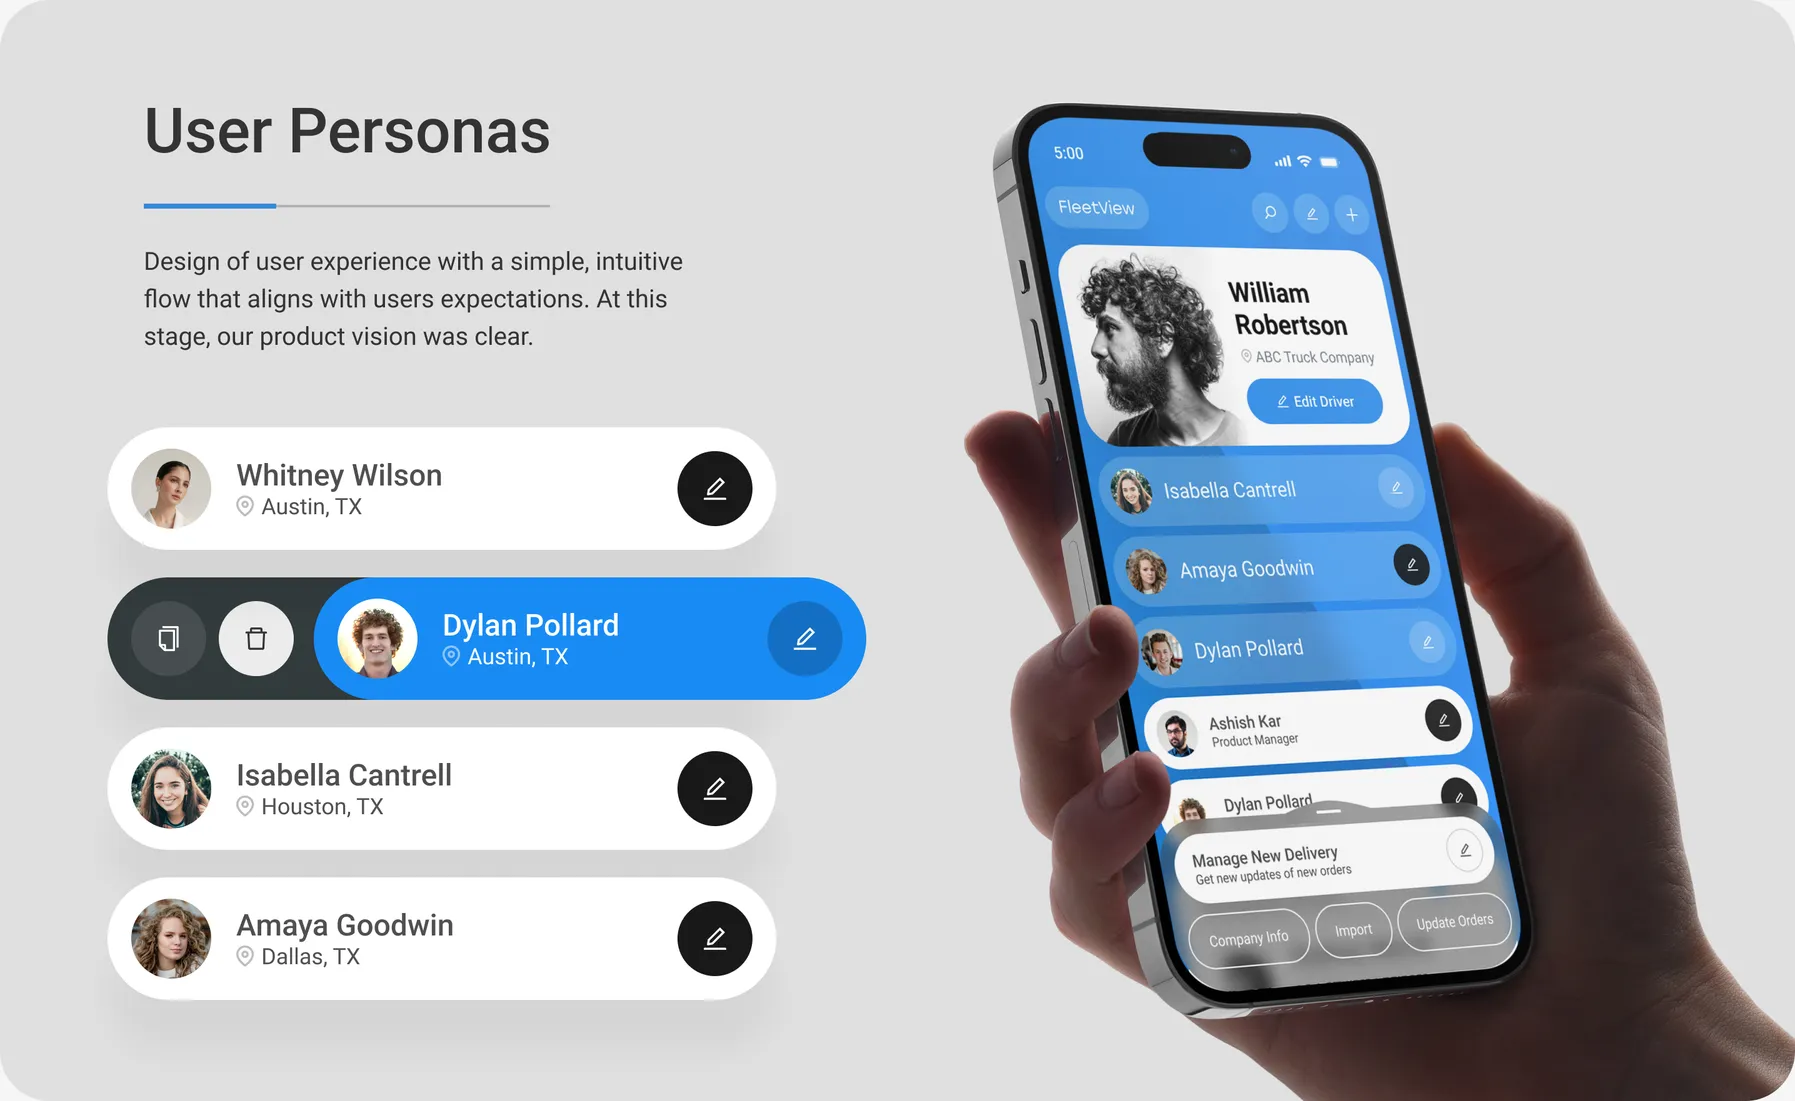
User Personas
We created user personas to represent our target audience, capturing key details like demographics, behaviors, goals, and pain points.

Max Miller
Age: 45
Experience: 20 years of long-haul trucking
Company: ABC Truck
Location: Dallas, TX
Job Type: Full-time, long-distance driver for a large freight company
Goals
- Maximize efficiency on long routes to increase earnings.
- Reduce downtime caused by vehicle maintenance or delays.
- Access accurate and real-time information on weather, traffic, and delivery schedules.
- Maintain a healthy work-life balance by managing routes that allow for optimal rest periods.
- Use technology to streamline paperwork and compliance checks, minimizing hassle.
Frustrations
- Inconsistent access to reliable mobile network coverage, hindering navigation and communication.
- Complicated compliance paperwork that consumes valuable time.
- Delays caused by traffic congestion or road closures that aren't communicated in real-time.
- Difficulty finding safe, convenient parking and rest areas along long routes.
- Limited support from dispatch teams during emergencies or unexpected situations.

Sarah Johnson
Age: 32
Experience: 8 years of regional trucking
Location: Phoenix, AZ
Job Type: Independent owner-operator
Goals
- Optimize route planning to minimize fuel costs and travel time.
- Ensure timely deliveries to maintain high customer satisfaction and secure repeat business.
- Manage vehicle maintenance proactively to avoid costly repairs and downtime.
- Use mobile tools to easily track deliveries, payments, and client feedback.
- Stay compliant with safety regulations and log hours accurately without paperwork overload.
Frustrations
- Difficulty integrating multiple apps for navigation, payments, and communication, leading to inefficiency.
- High fuel costs due to poorly optimized routes or unexpected detours.
- Lack of reliable information on available parking spaces and facilities for truck drivers.
- Challenges in maintaining work-life balance due to irregular hours and long distances.
- Limited access to resources for managing vehicle repairs or maintenance on the road.
Application Design
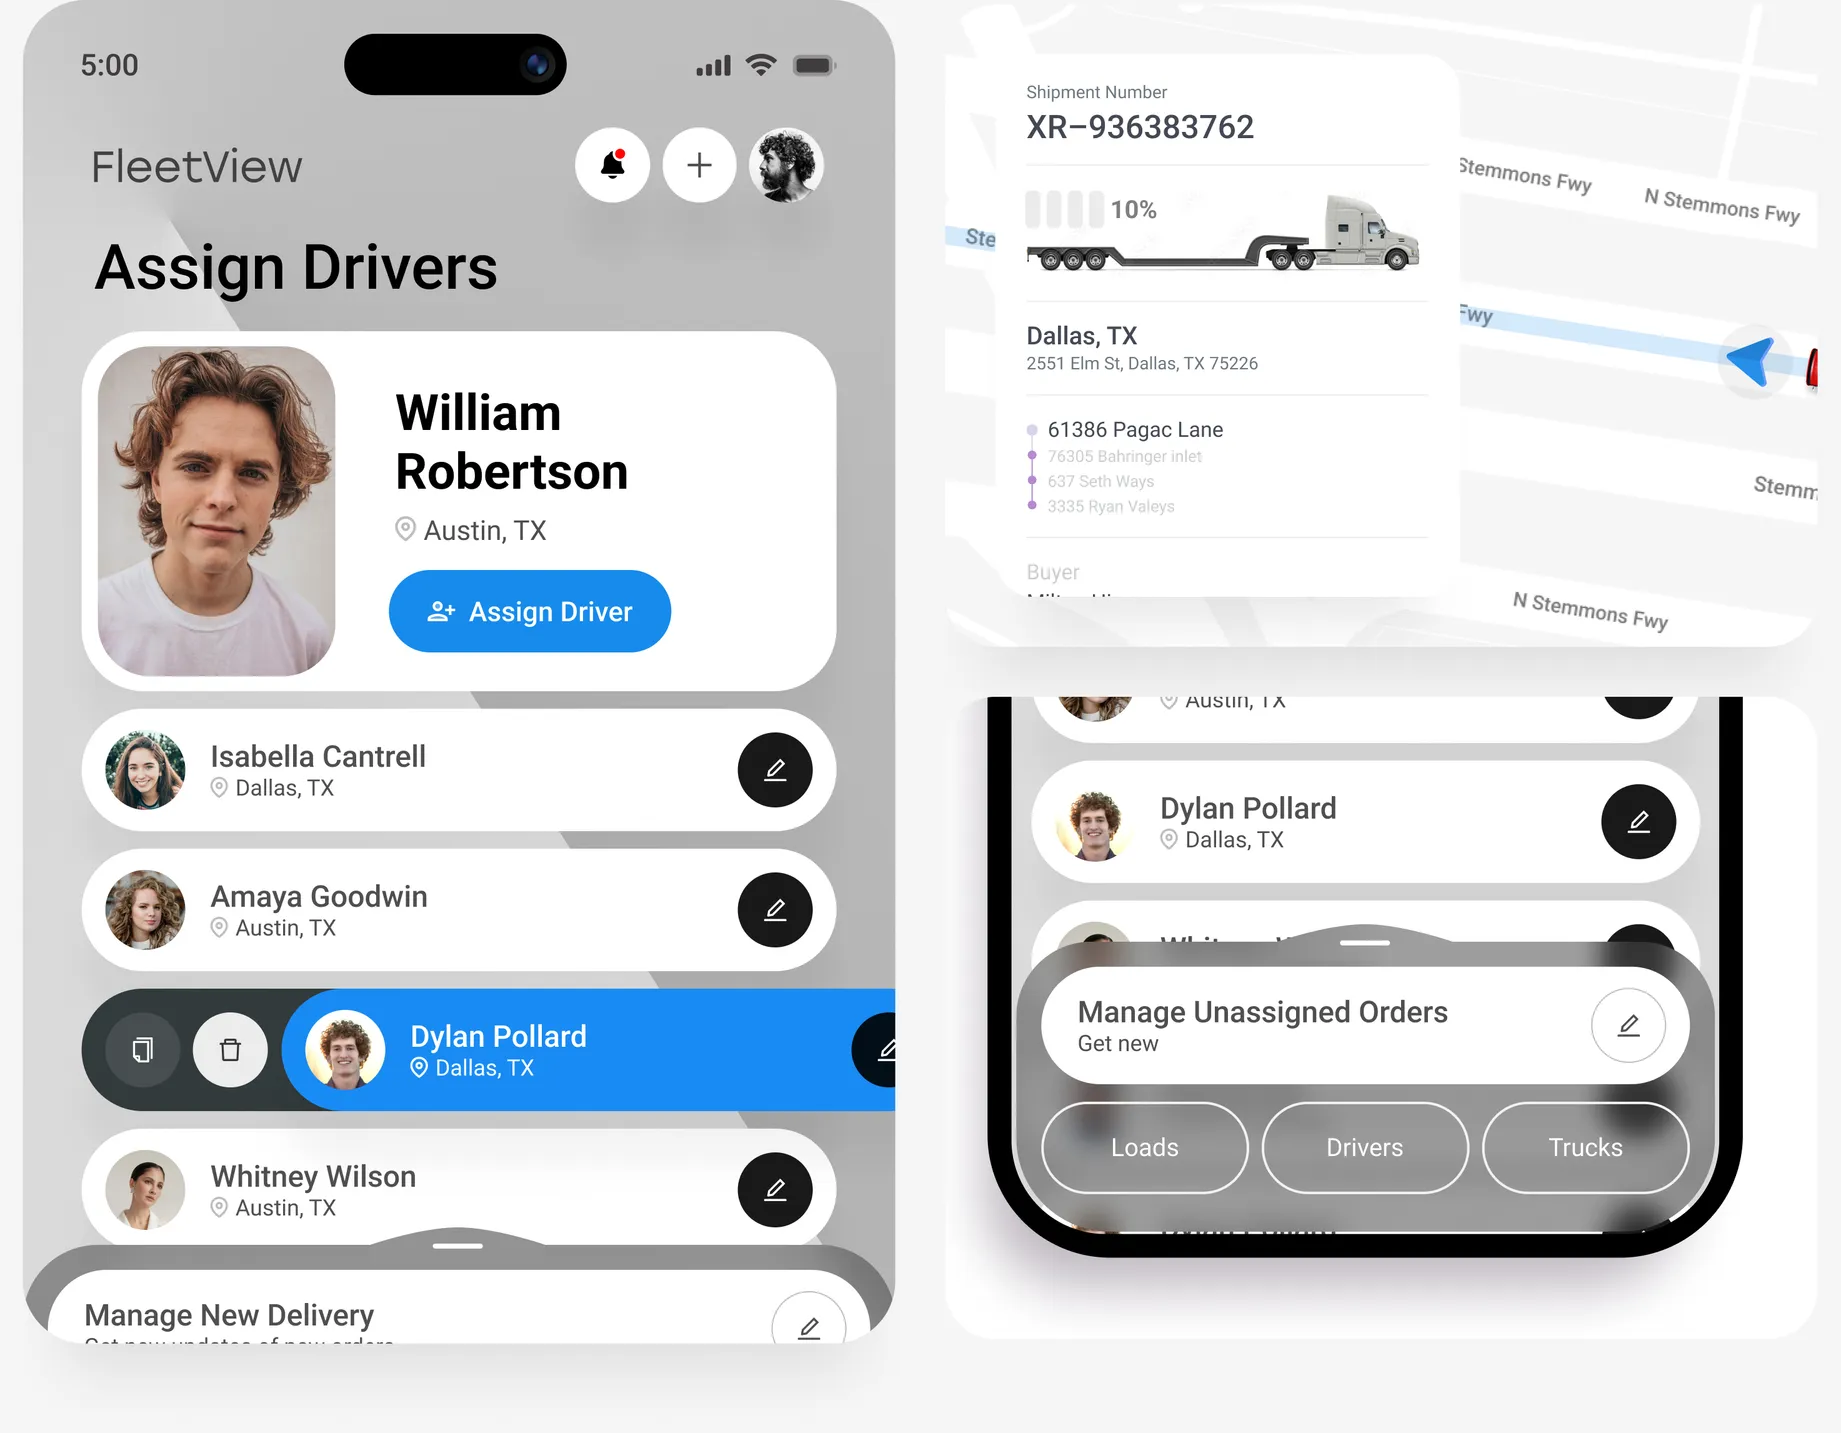
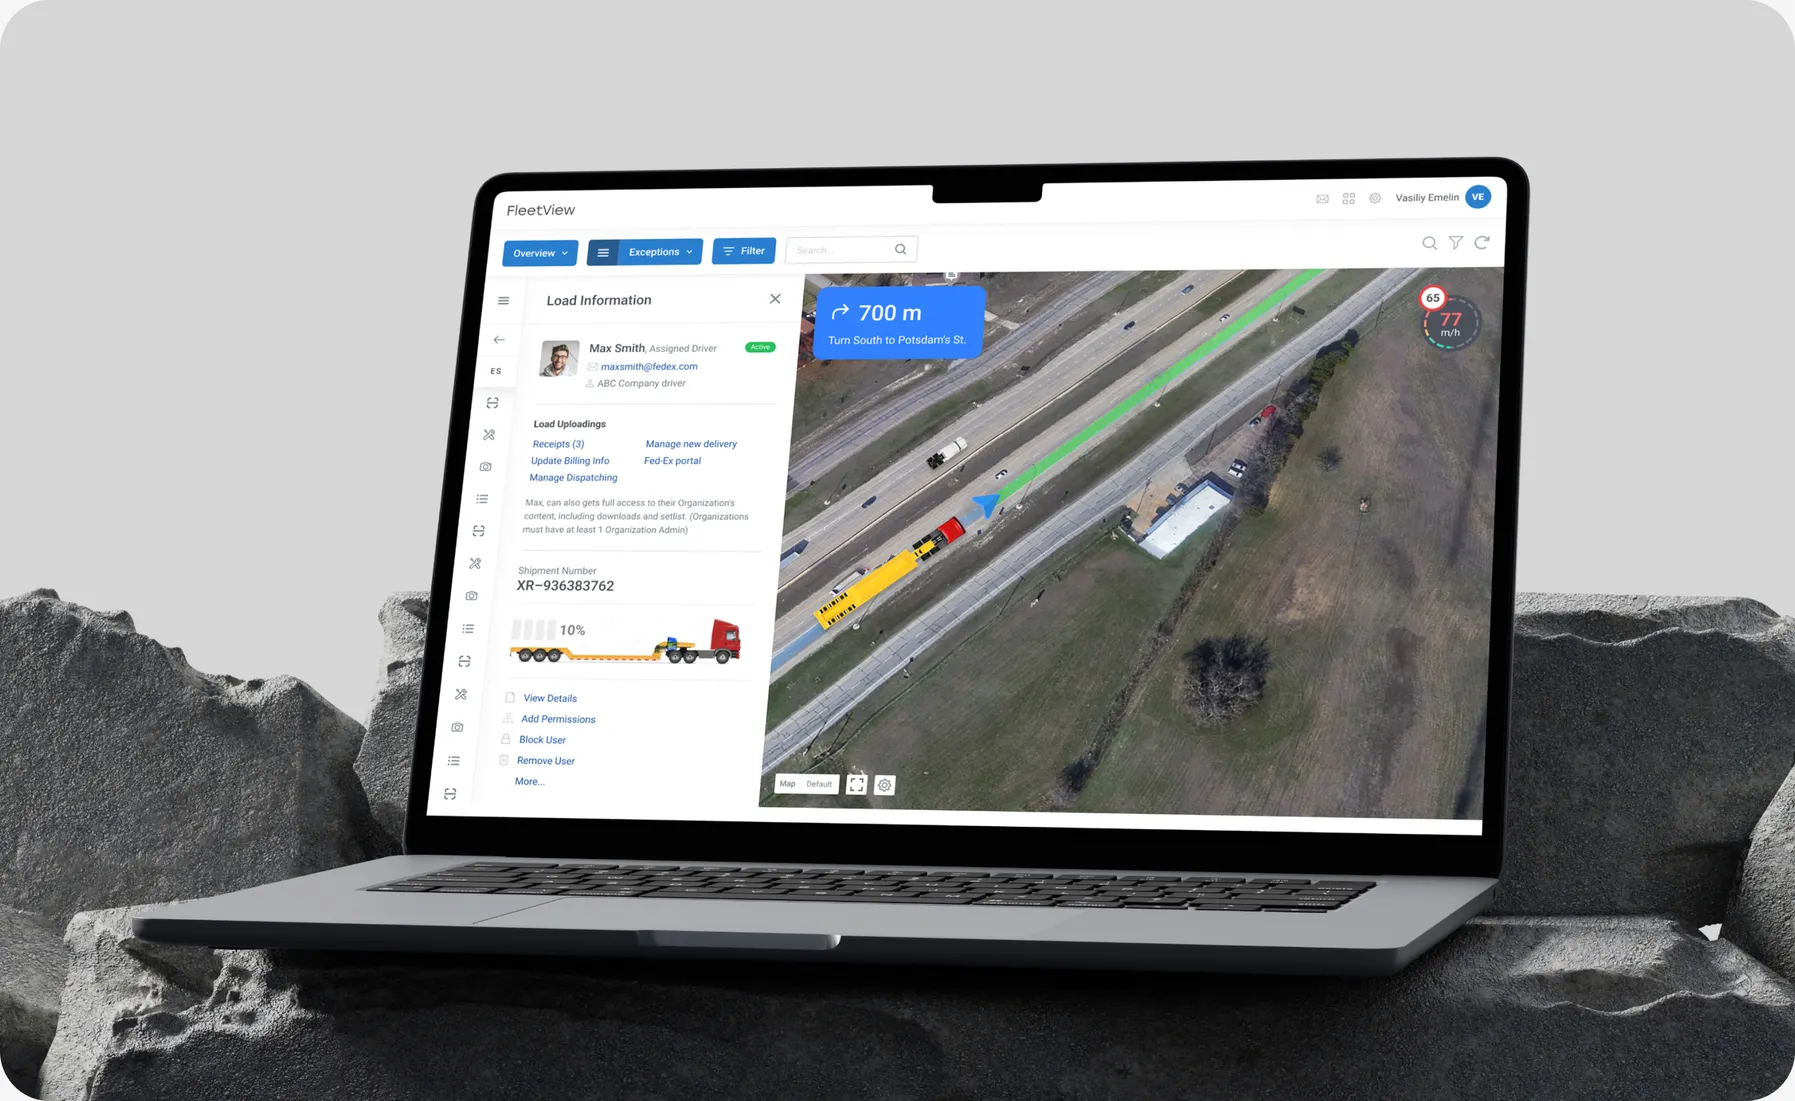
Driver Load Details
& Map Overview
This page provides drivers and fleet managers with comprehensive details about current and upcoming loads. It also displays real-time updates on load status, estimated arrival times, and any potential delays.
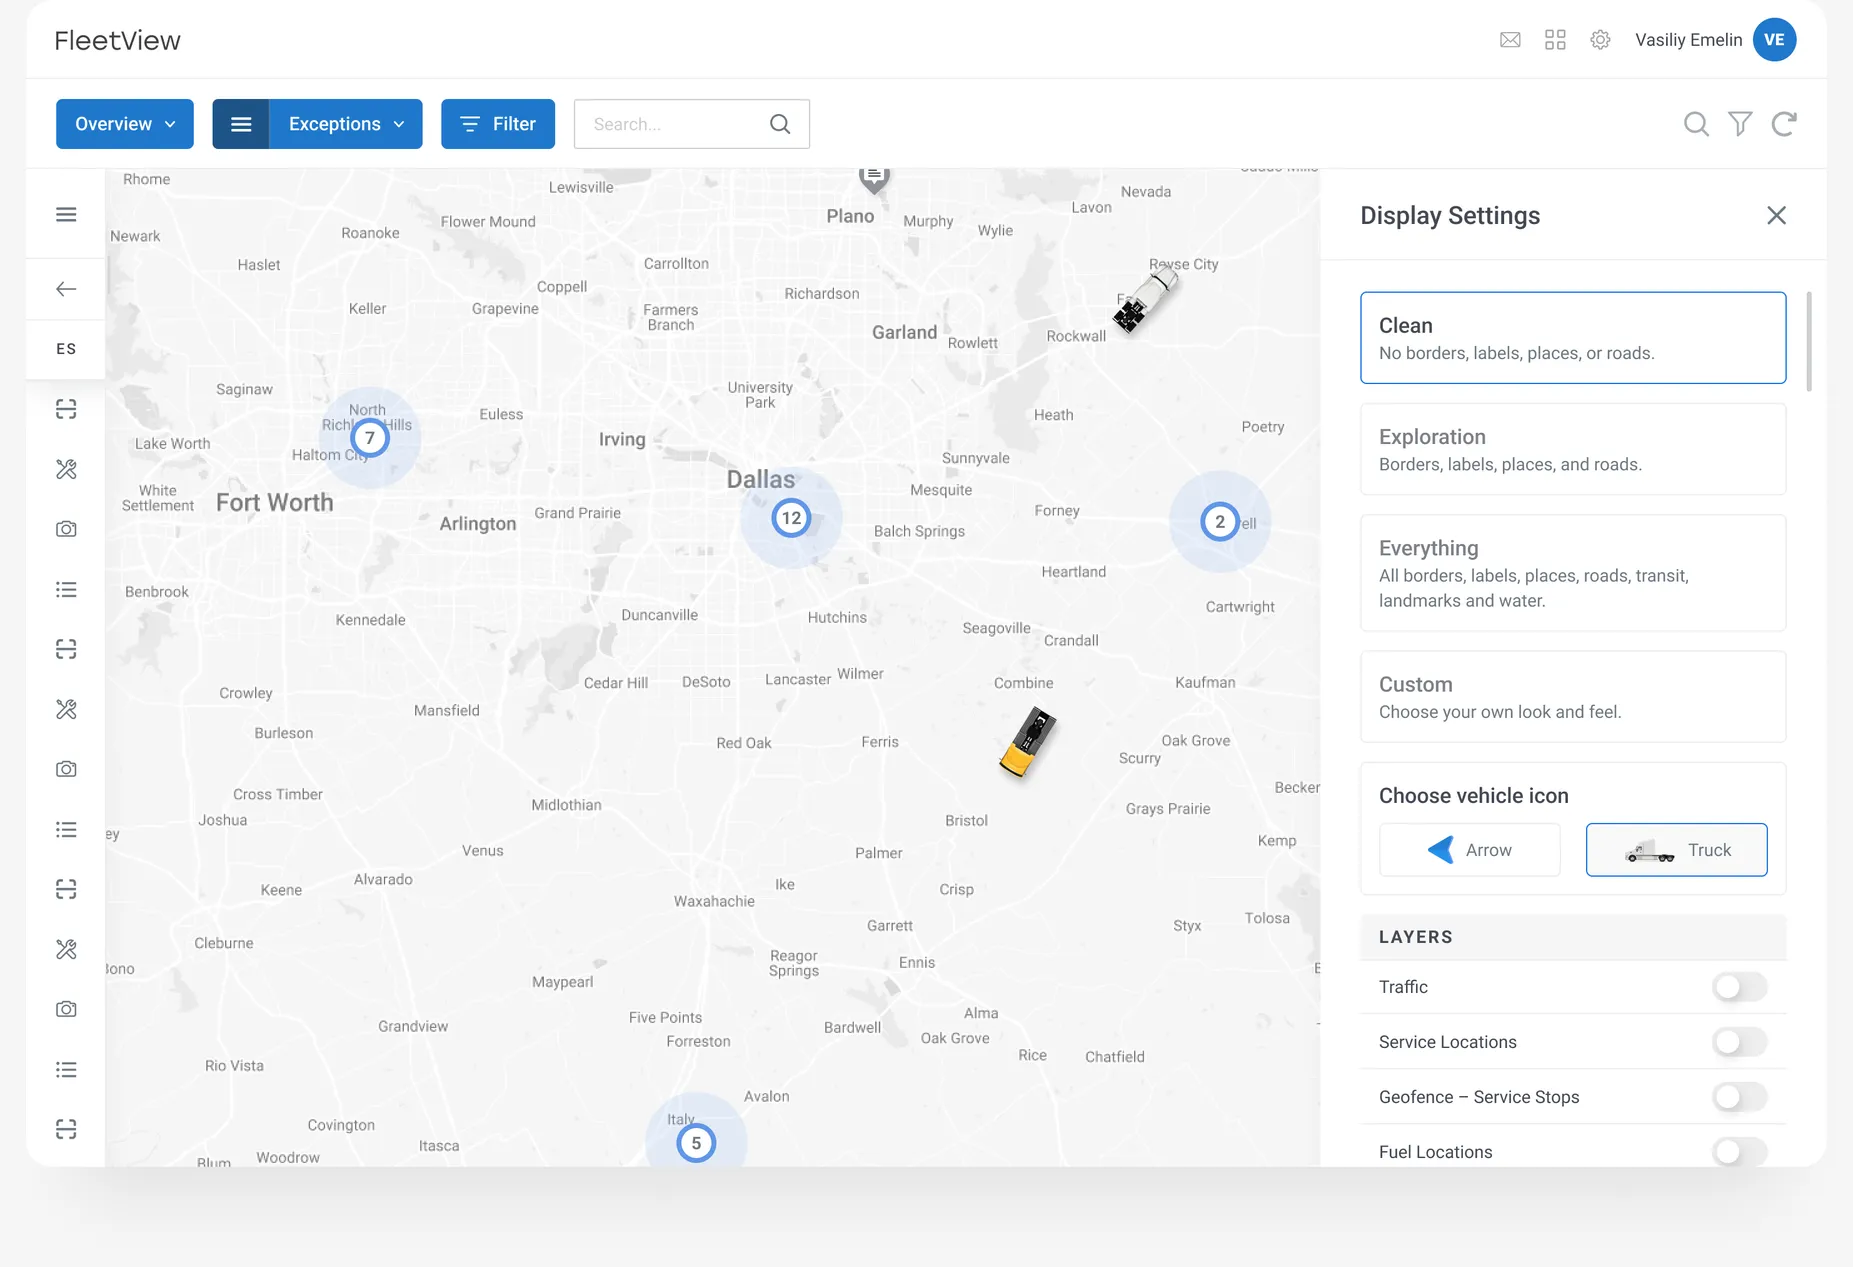
Display
Map Settings
The Display Map Settings section allows users to customize the map view for optimal navigation and load tracking. It offers flexibility in how map information is presented, enhancing the user's ability to visualize routes, track progress, and make informed decisions on the road.
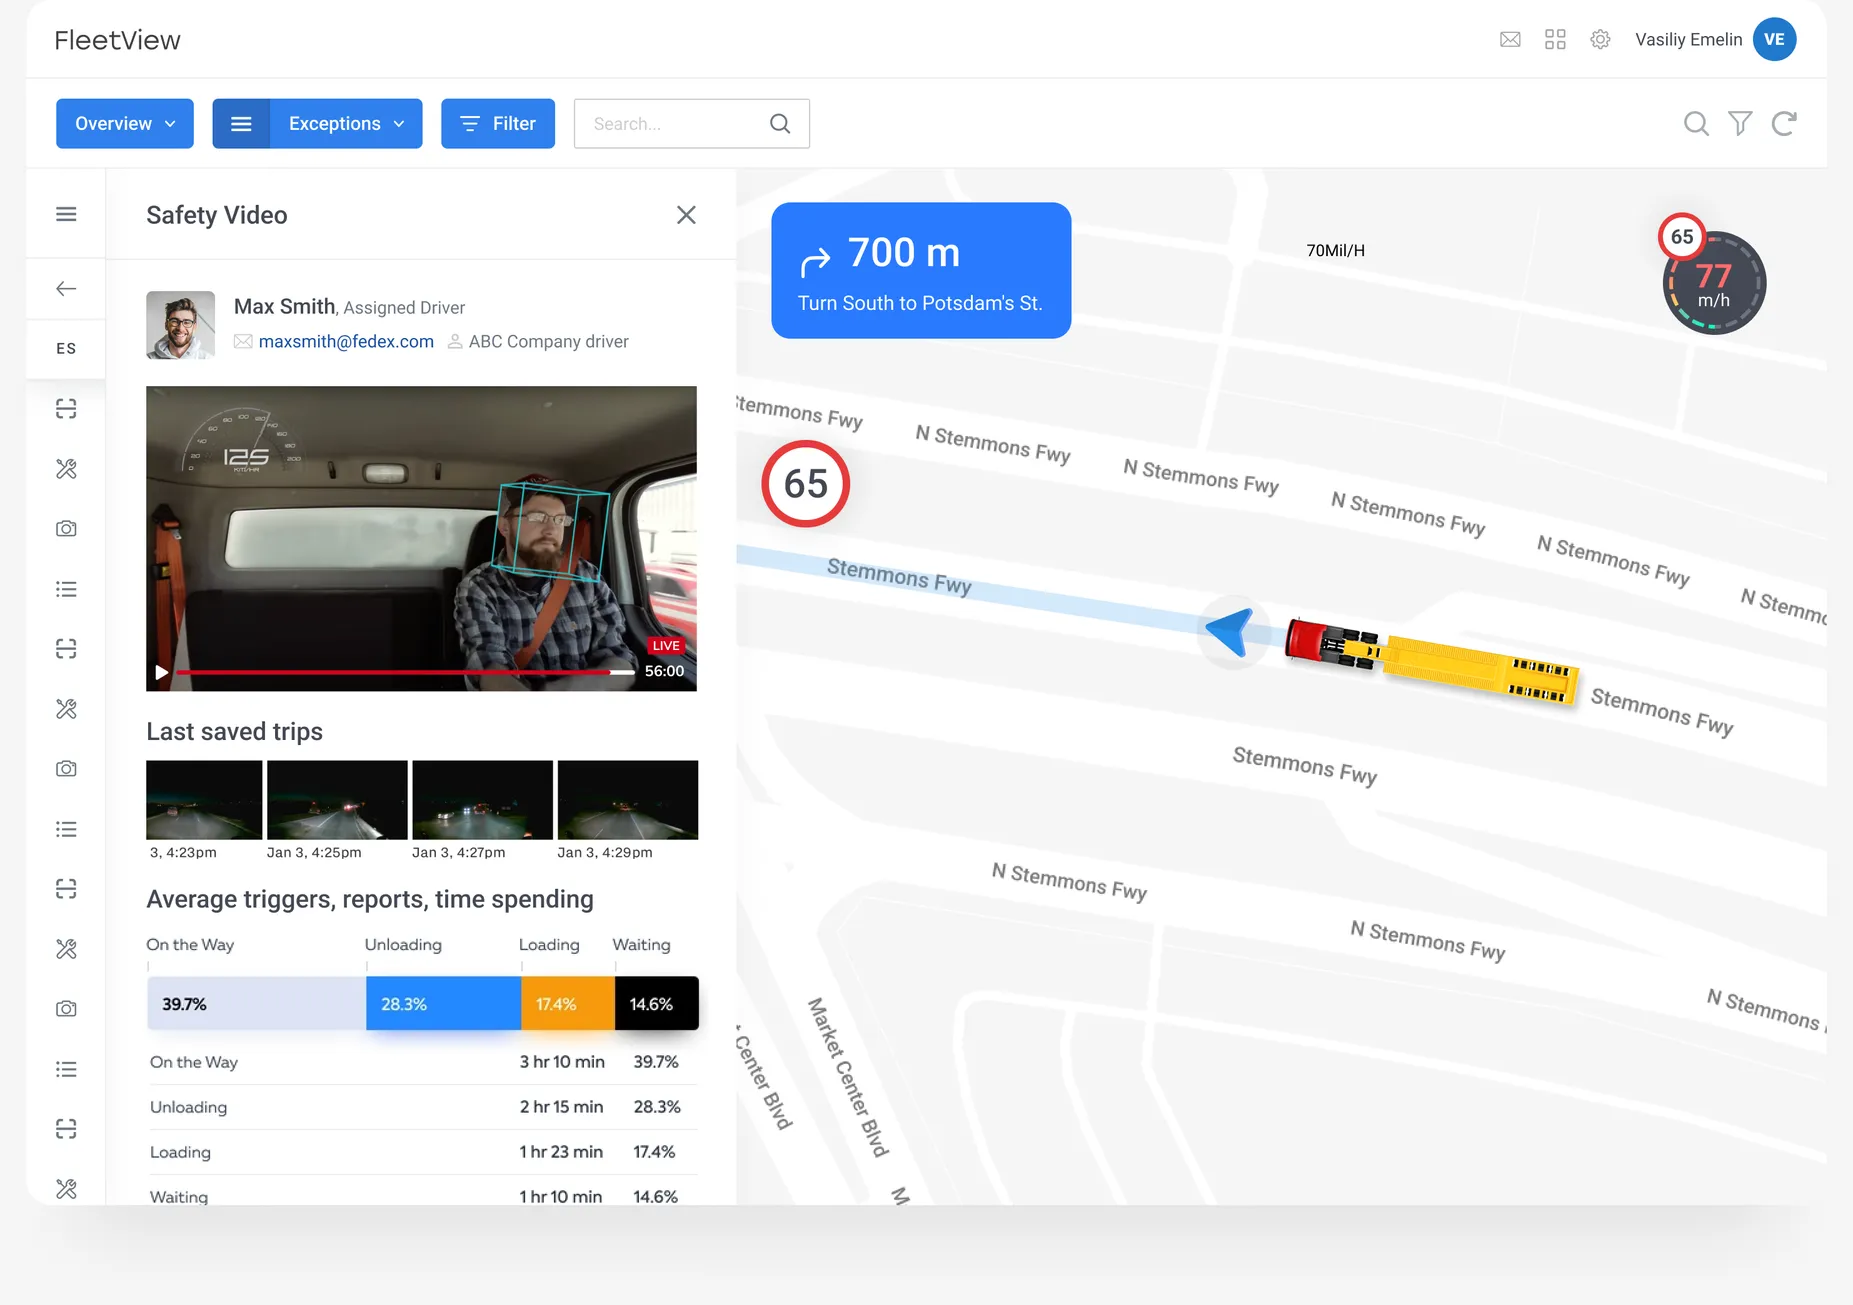
SafetyDriver behavior monitoring.
The Safety App within the Fleet Solution is designed to enhance driver safety and ensure compliance with industry regulations. It provides real-time safety alerts, monitors driver behavior, and offers tools for reporting and addressing safety concerns on the road.
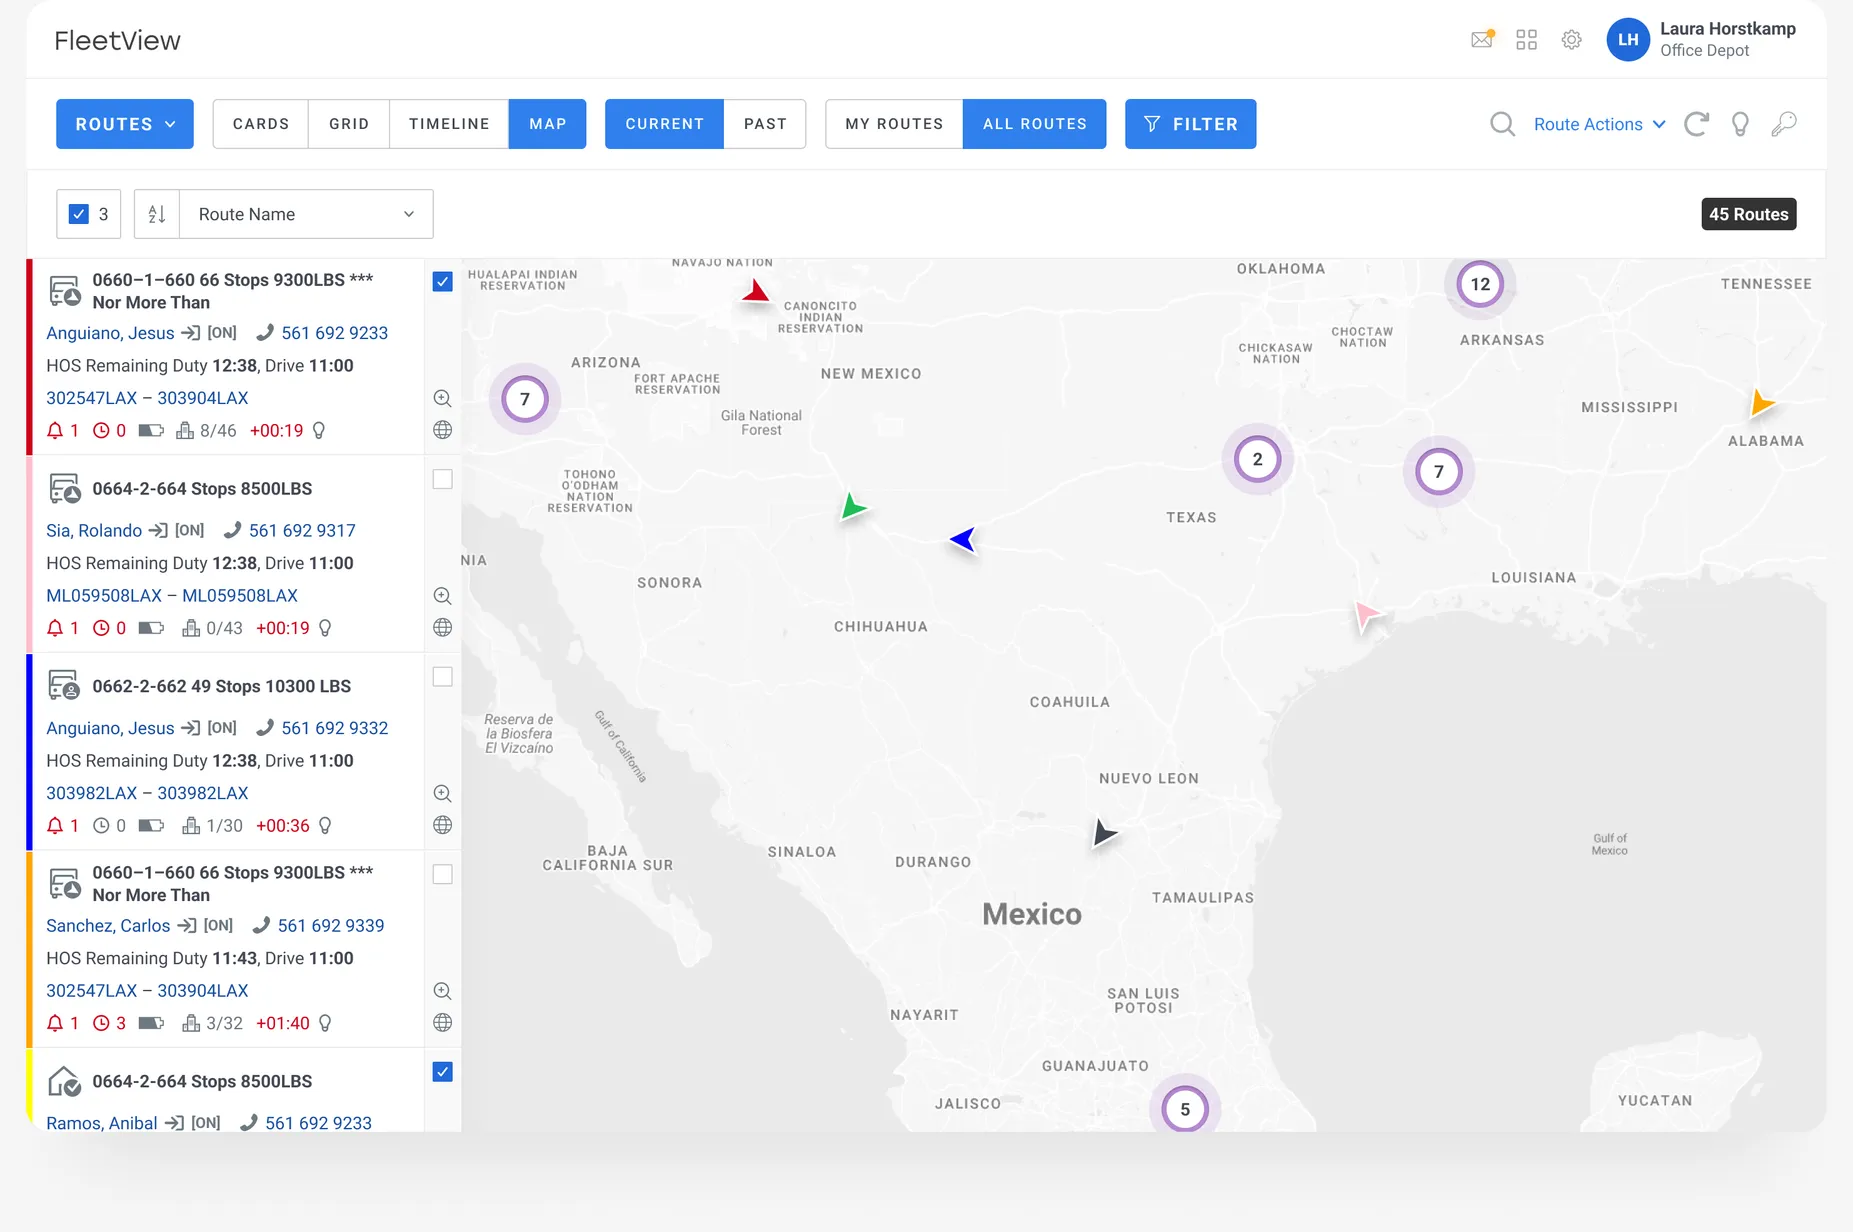
Routes On MapRoute visualization, waypoints and stops.
Helicopter view, gain instant clarity with a comprehensive aerial overview of your assets. Eliminate guesswork and streamline operations with real-time insights. Effortlessly optimize route navigation and empower customers to track their assets precisely and easily.
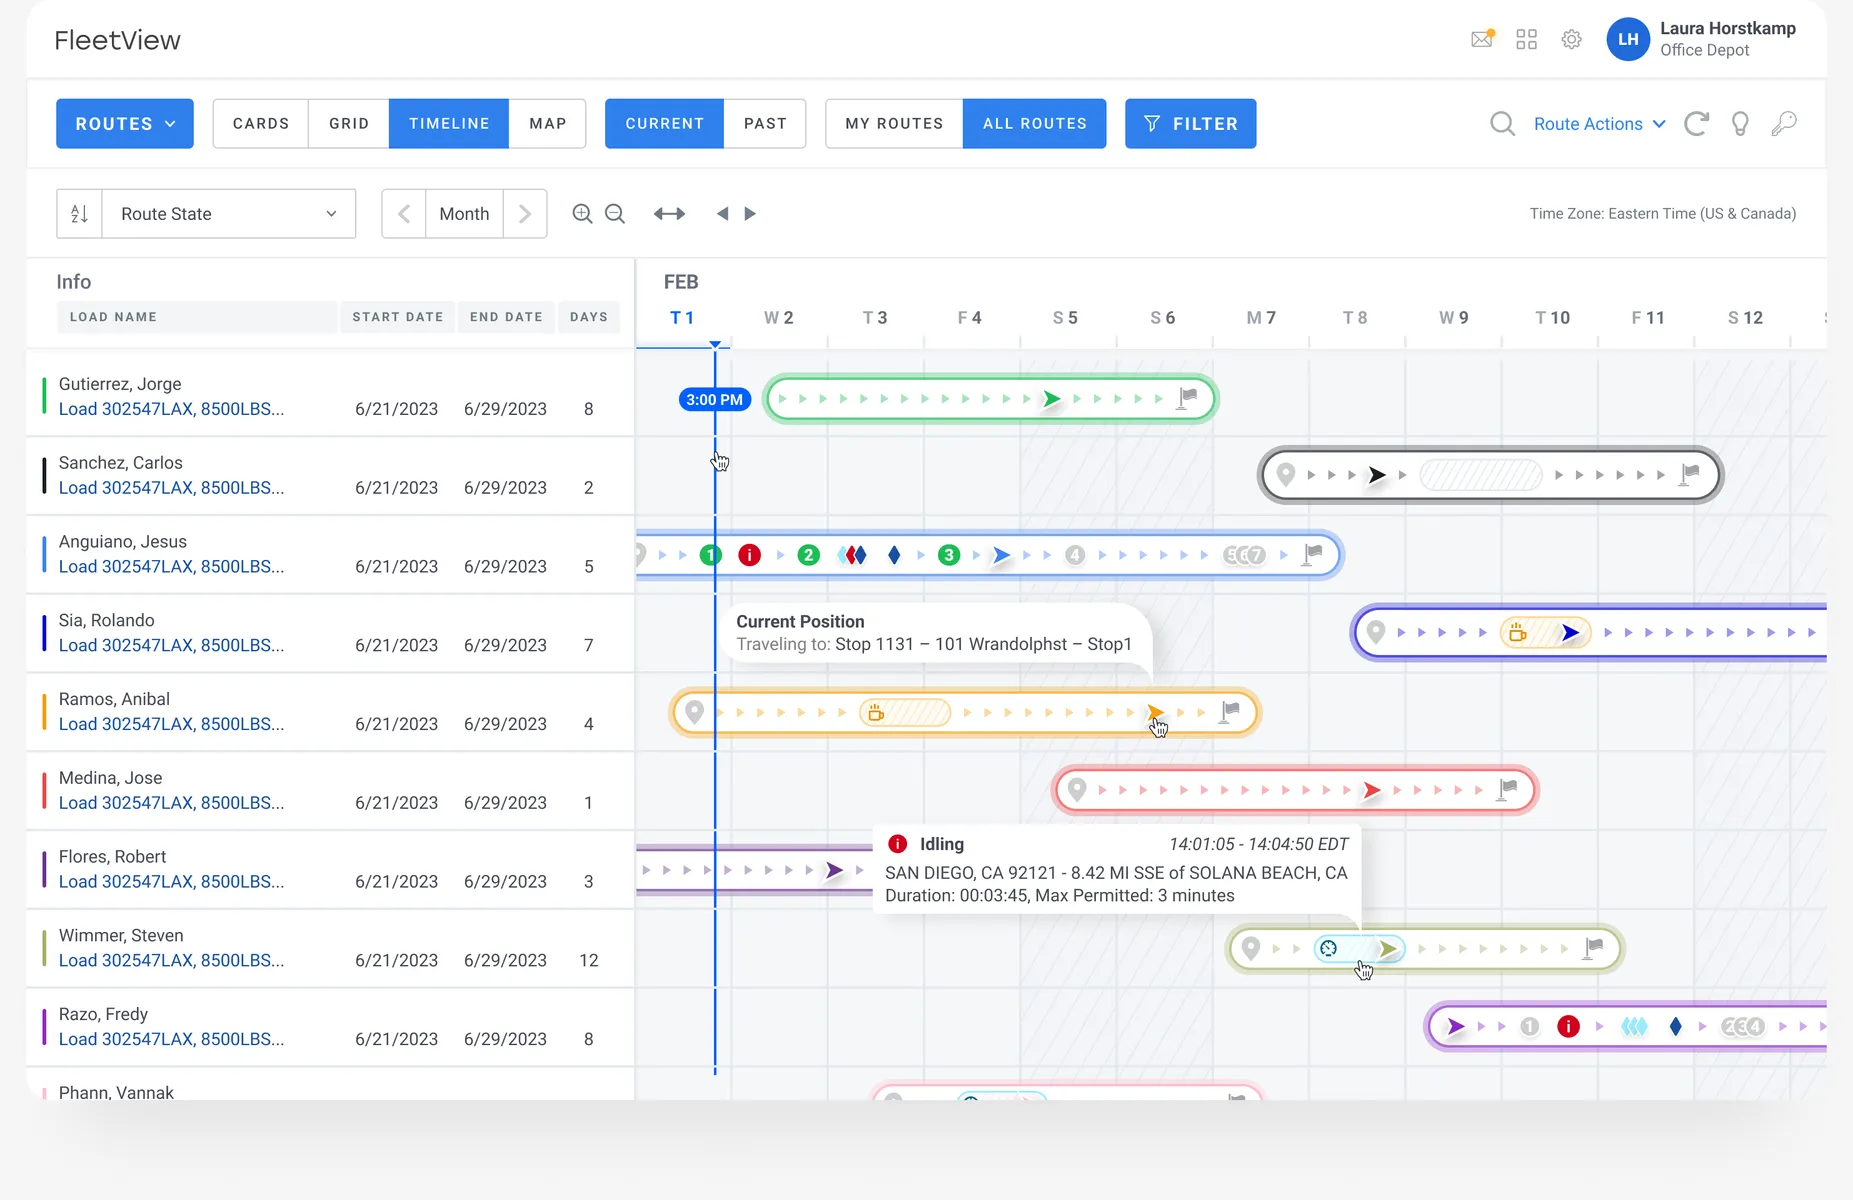
Routes Timeline
The Routes Timeline provides a chronological overview of a driver's journey, helping fleet managers and drivers track key milestones and ensure timely deliveries.
Health Data Management
This system collects and analyzes data from various vehicle sensors, providing real-time insights into the condition of the fleet and alerting drivers and managers to any maintenance needs.
- Real-Time Vehicle Monitoring
- Predictive Maintenance Alerts
- Diagnostic Reports
- Maintenance Scheduling
- Fuel Efficiency Monitoring
- Health Score
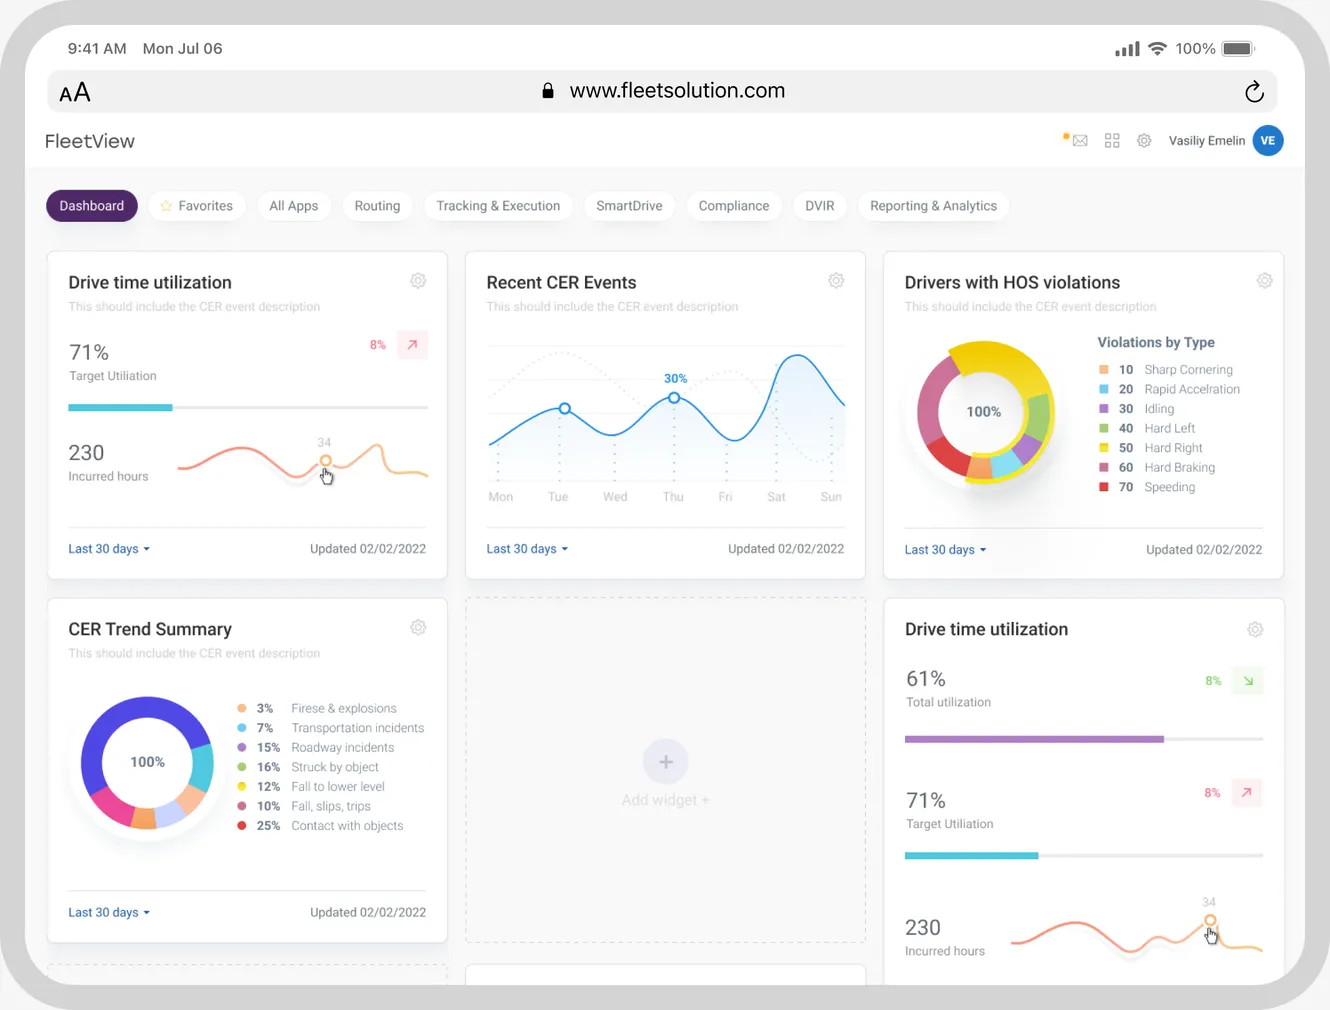

FleetView
Overview 153,800 vehicle matches
04
Categories,
Platform Flow
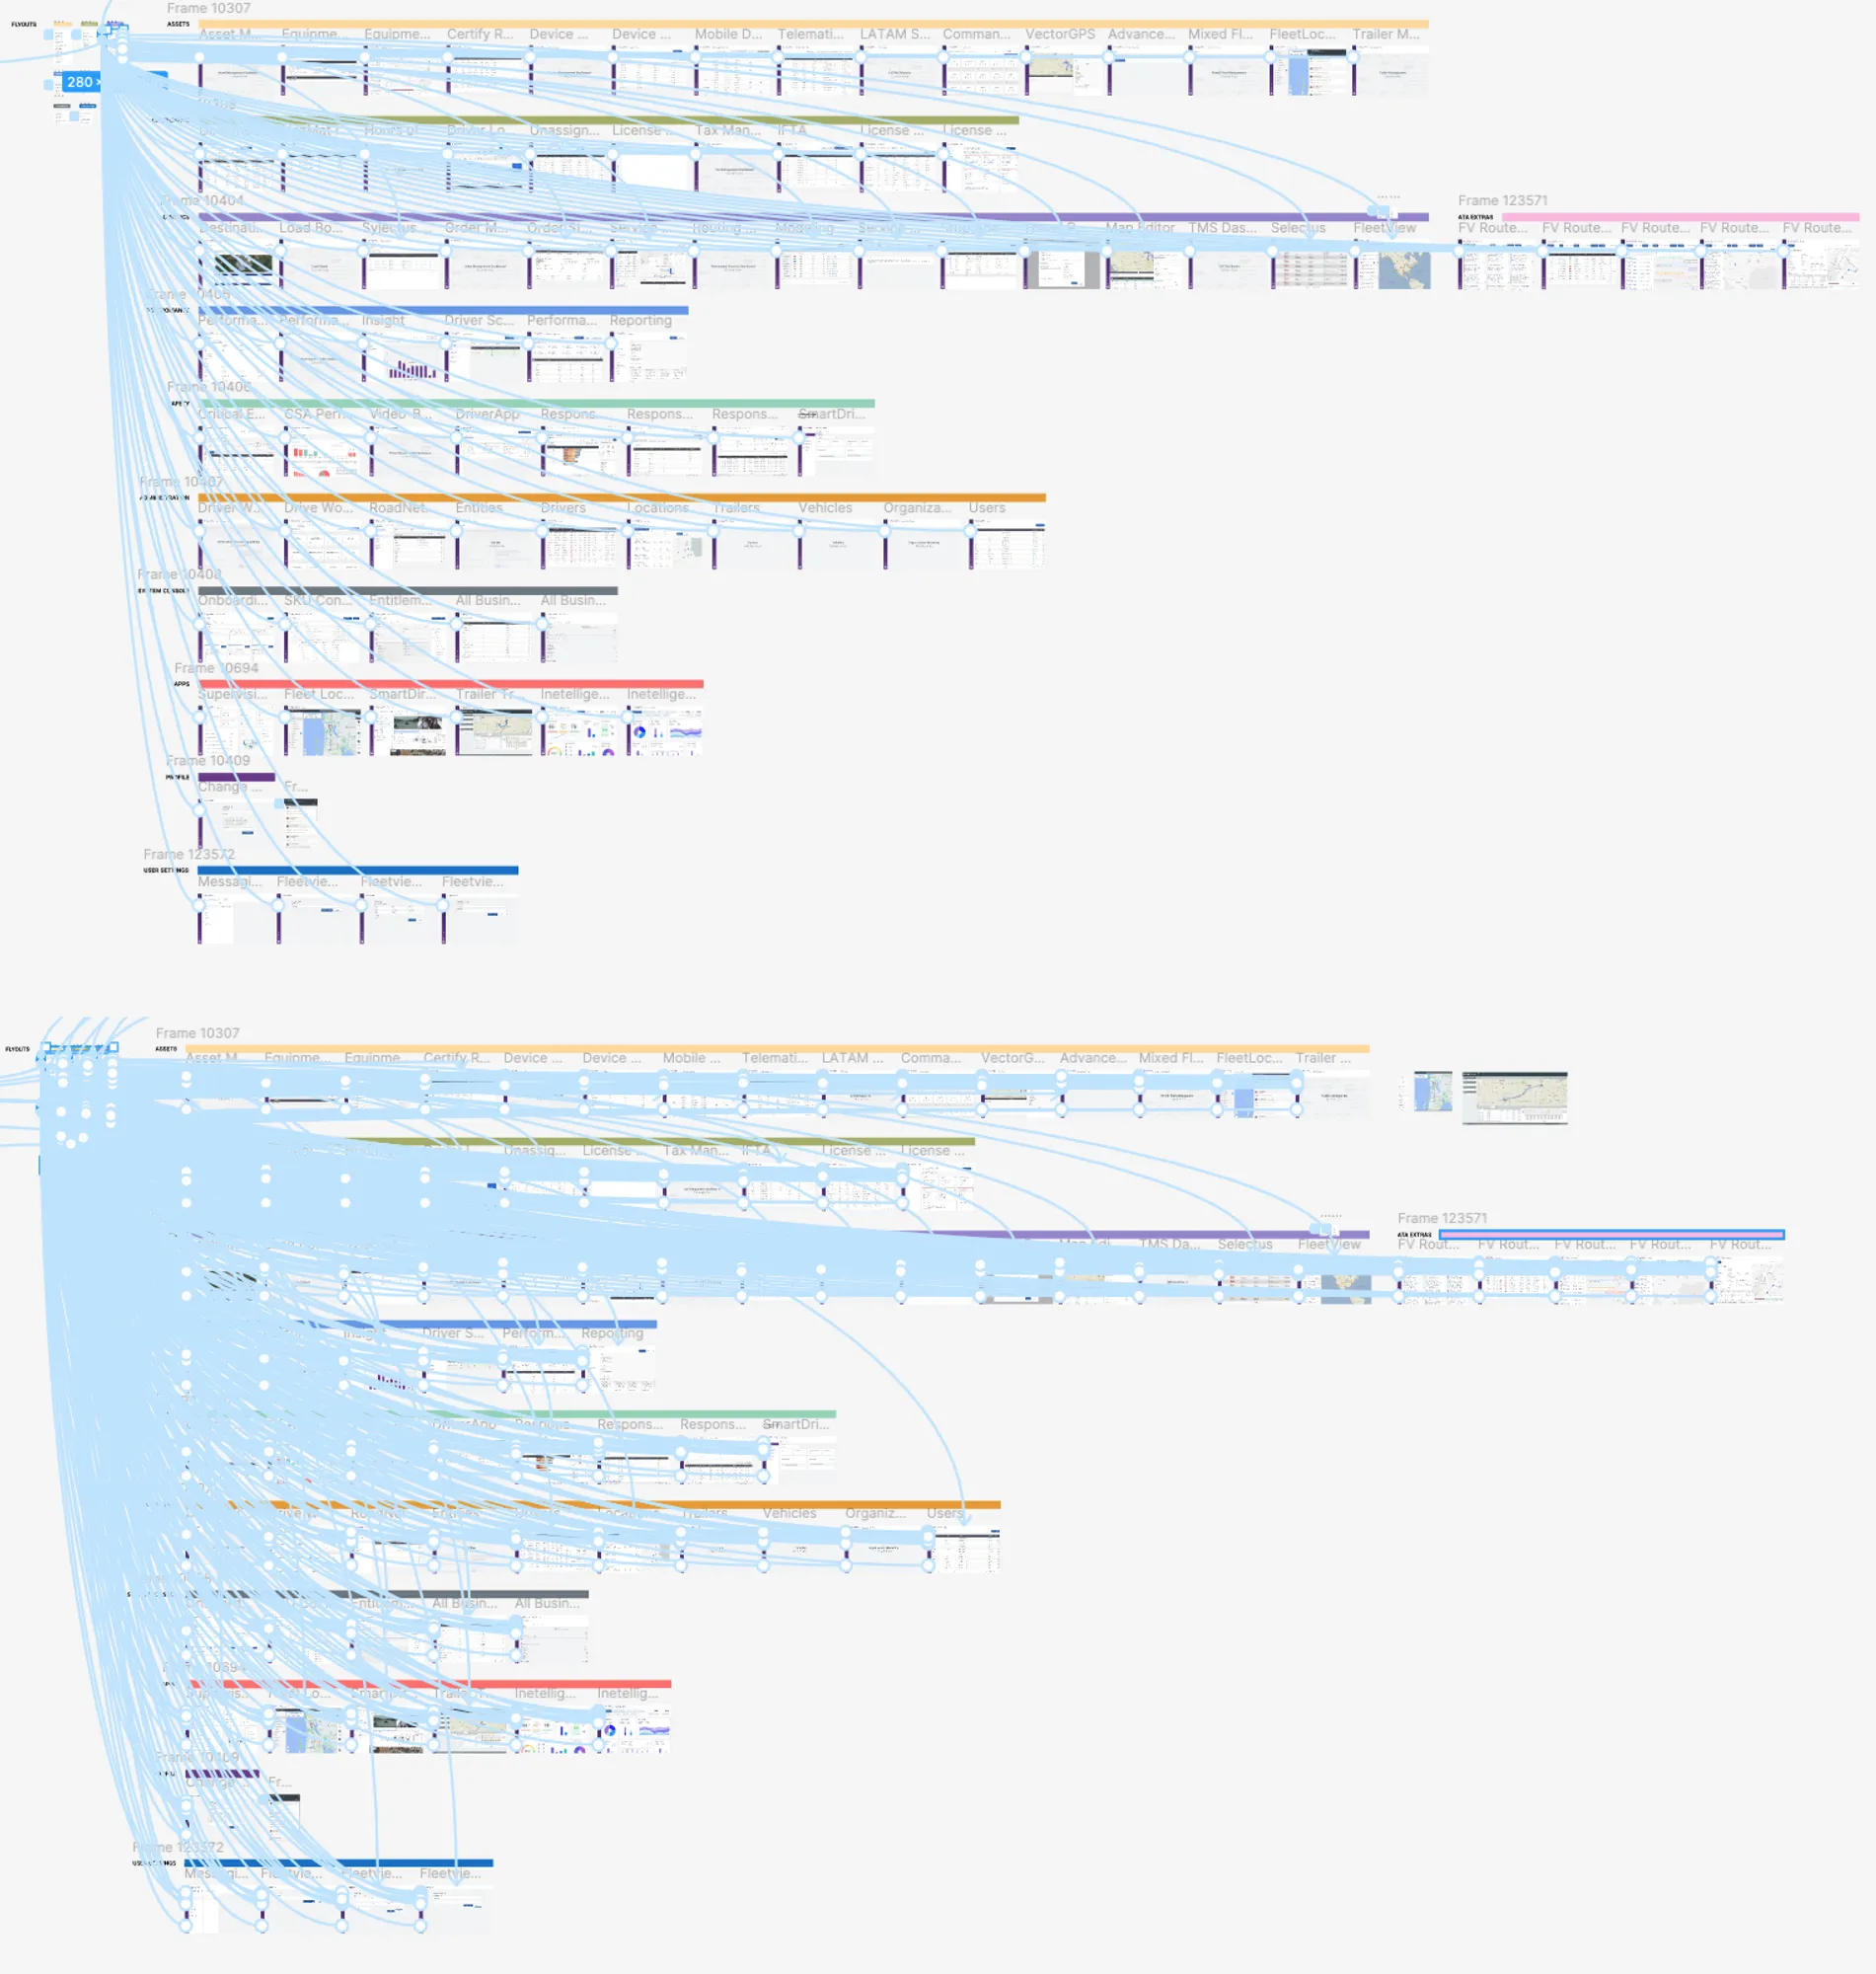
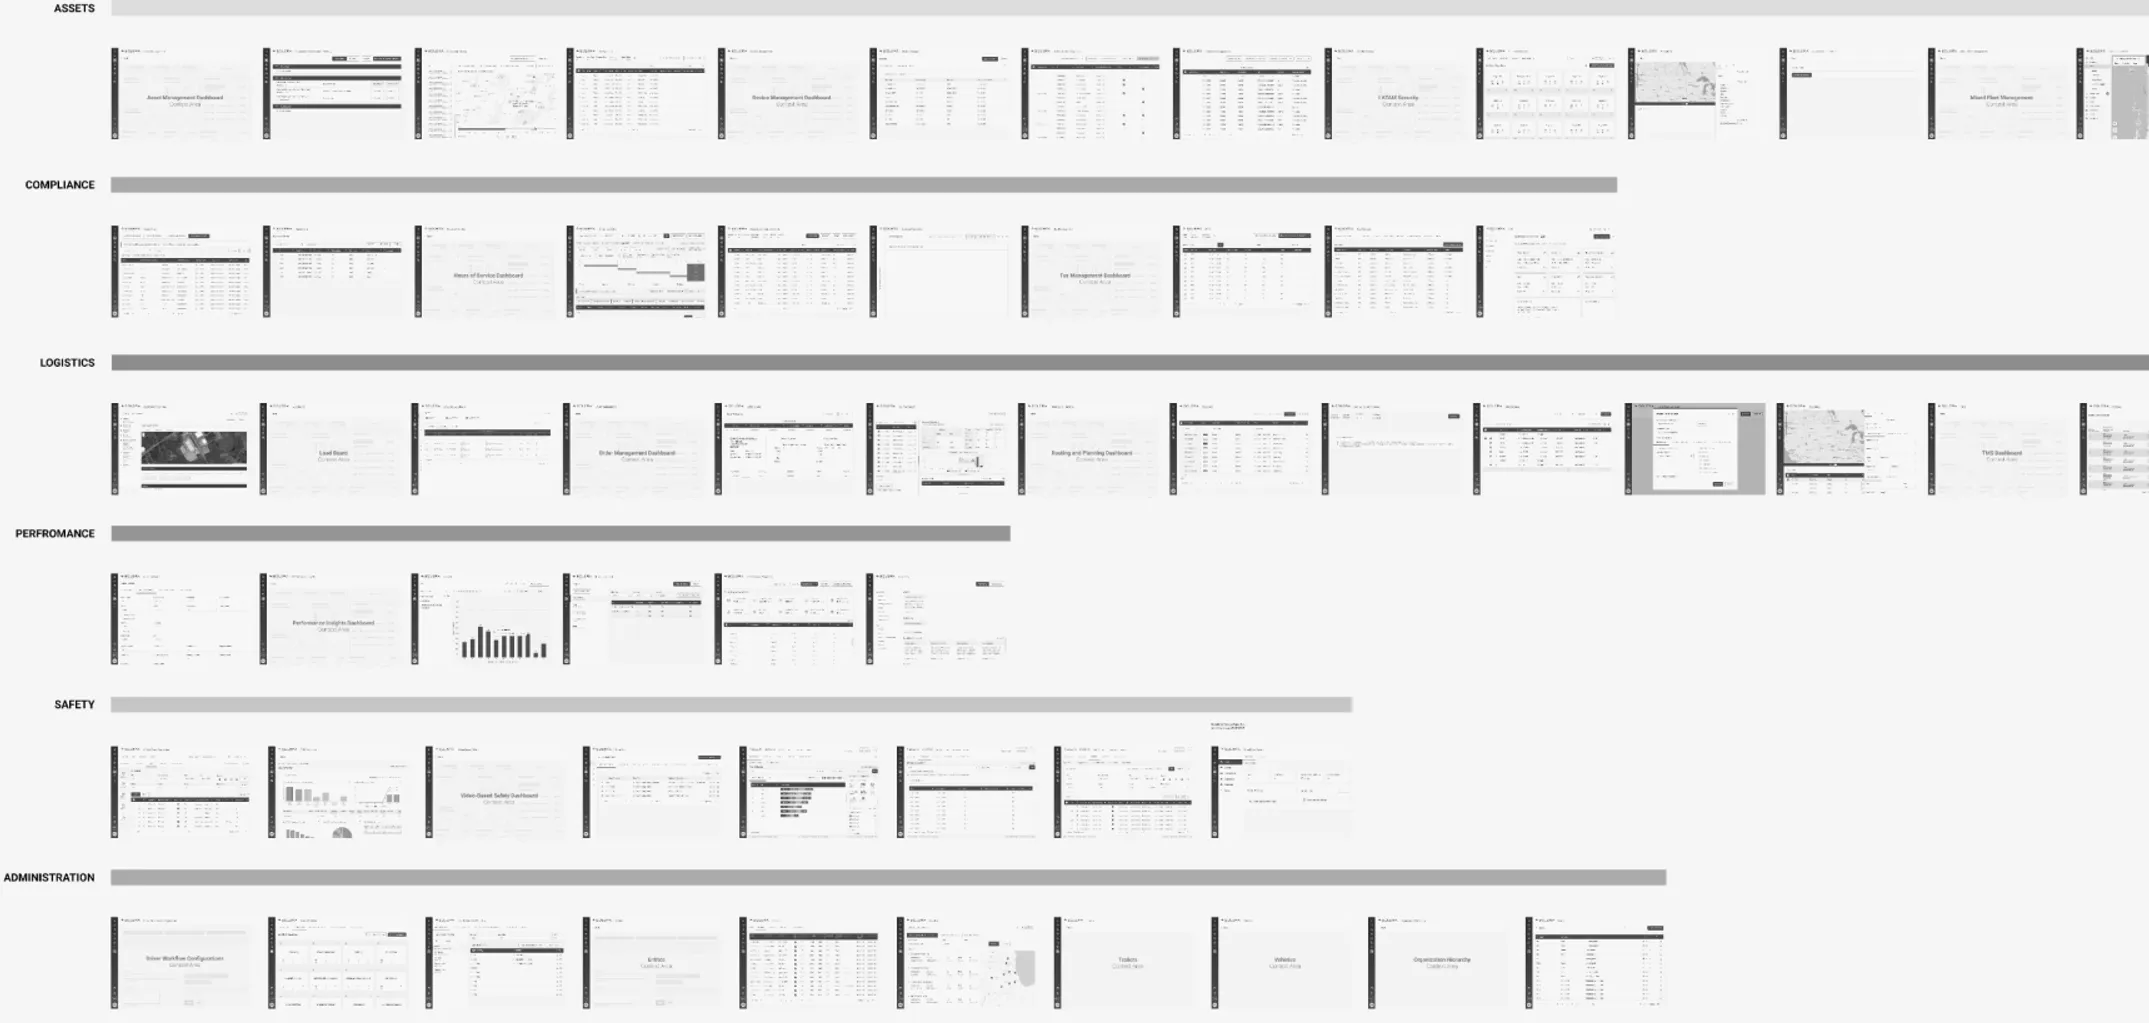
We designed a user experience with a clean, intuitive flow, encompassing over 100 screens, 16 categories, and 46 apps, along with multiple microservices with the fleet REST API data serving 40,000 real customers.
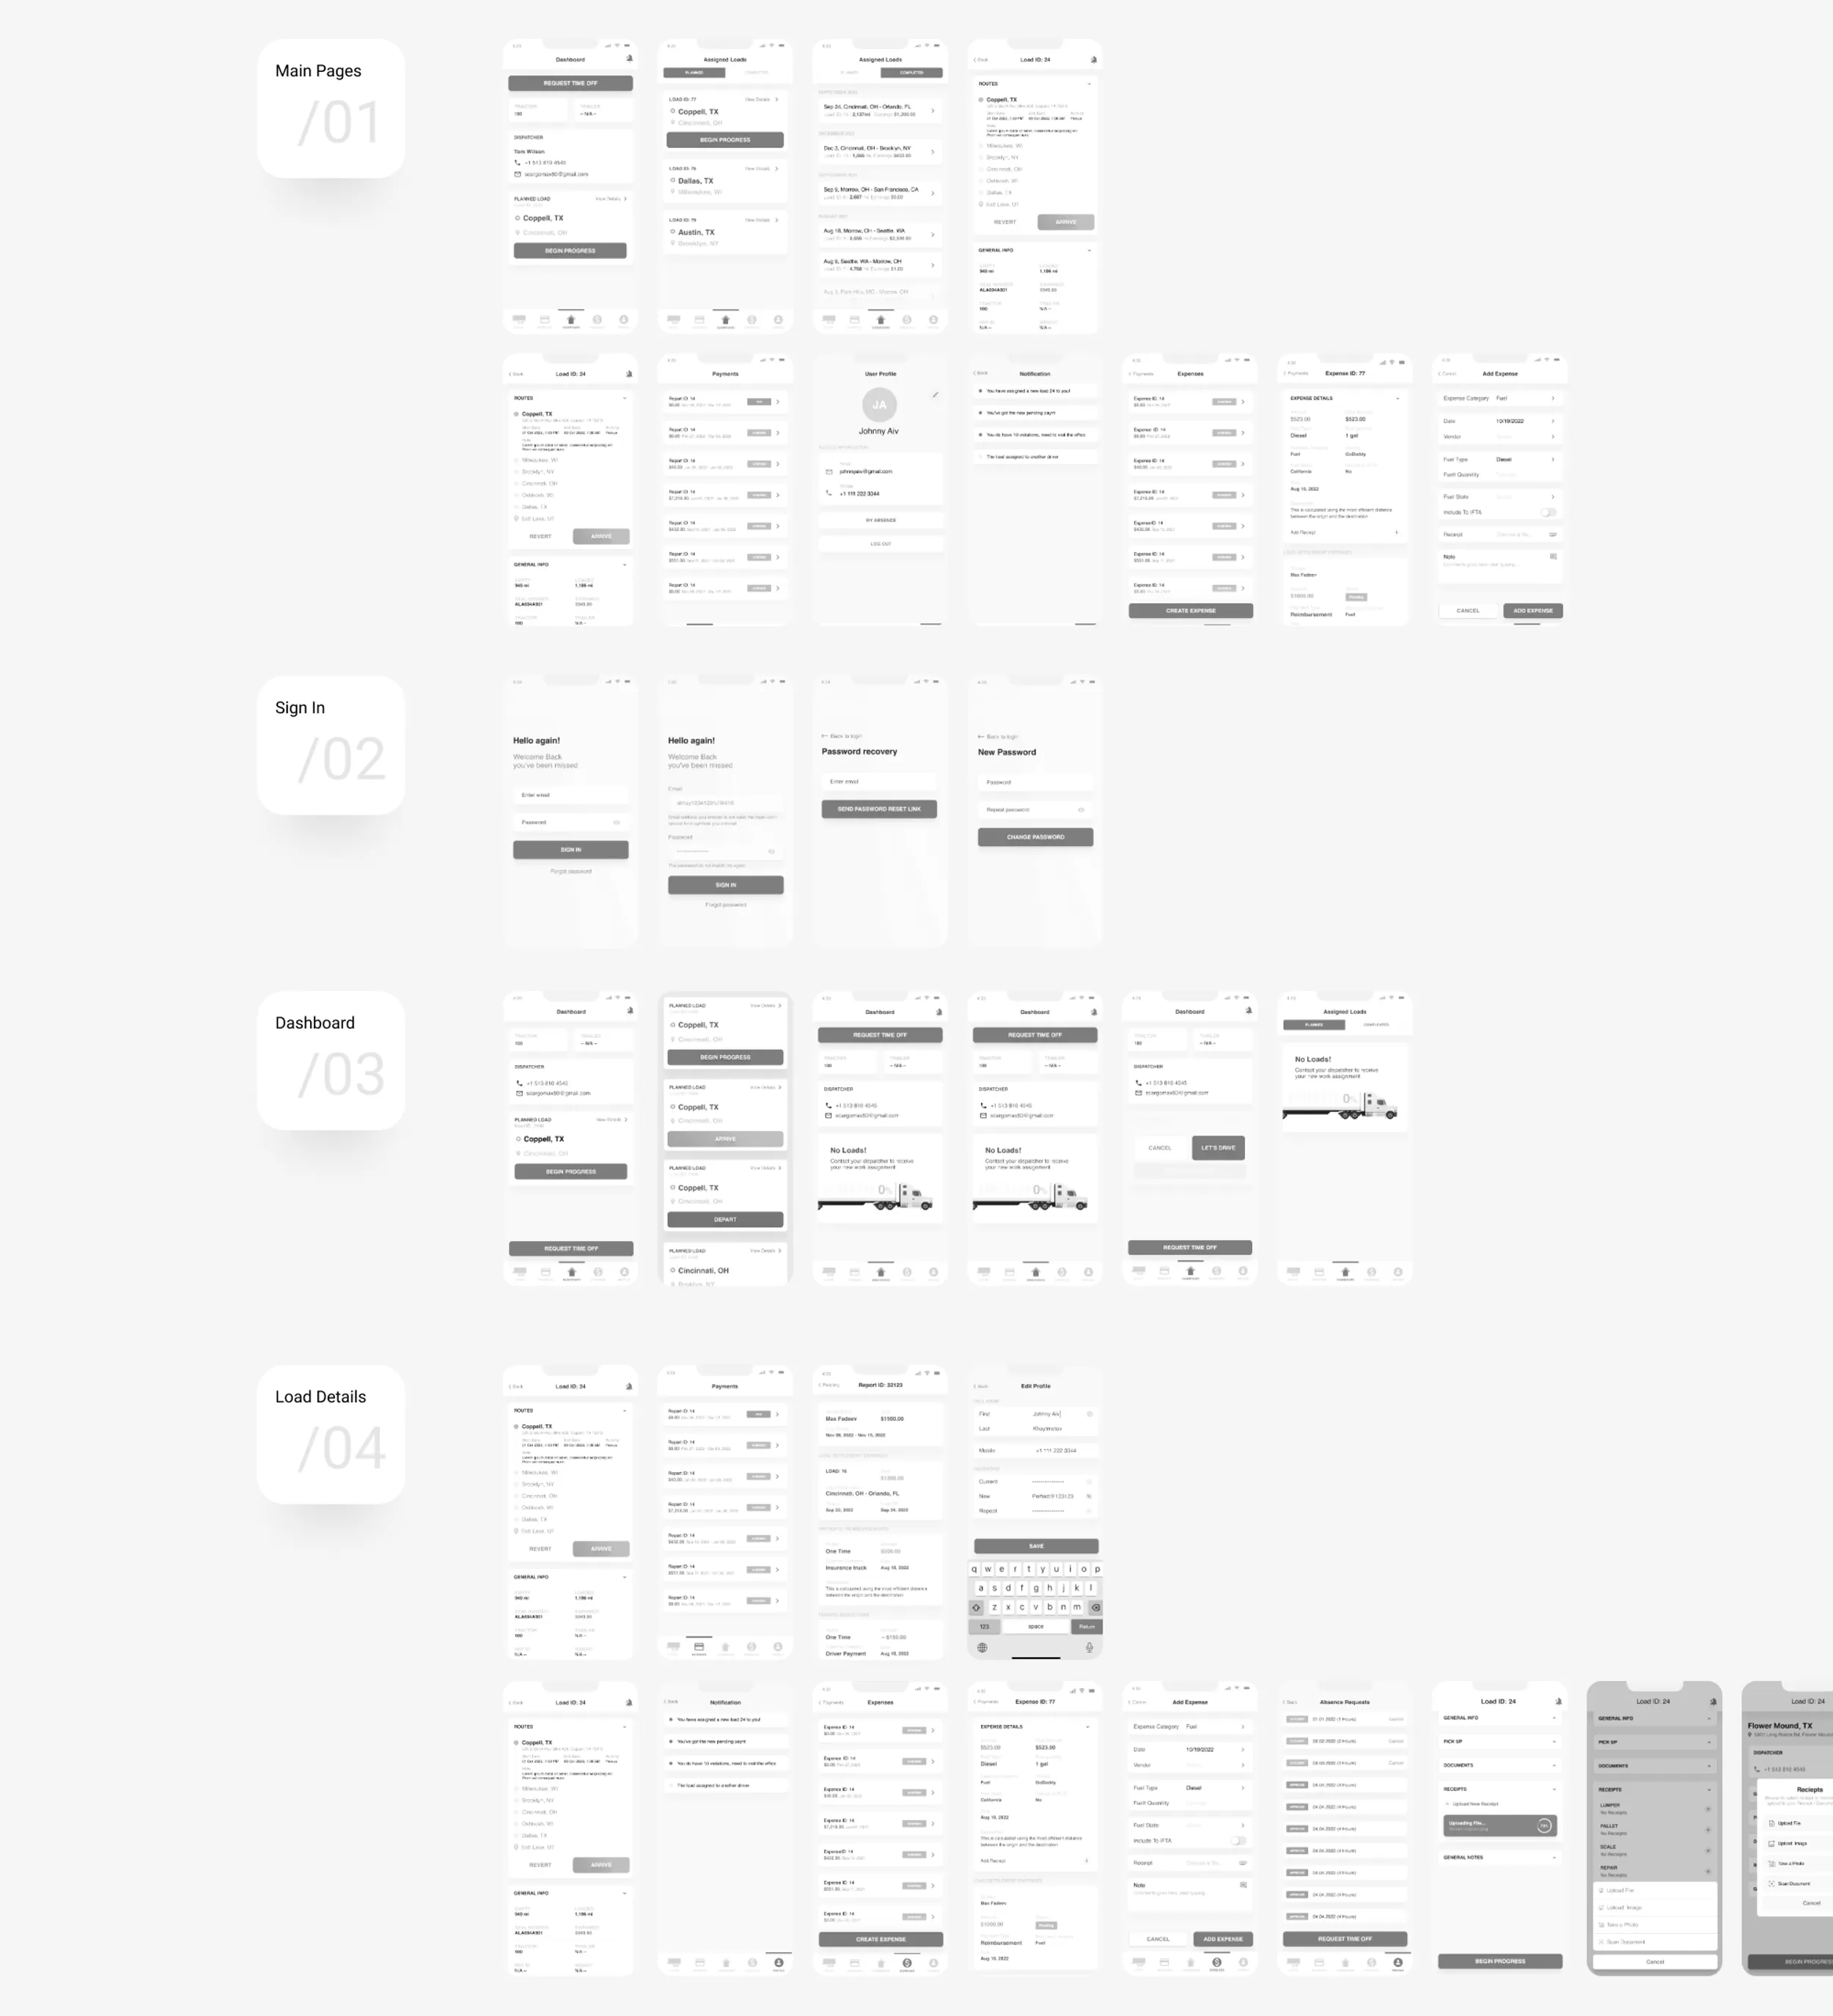
Website Flow
We designed a user experience with a clean, intuitive flow, encompassing over 100 screens, 16 categories, and 46 apps, along with multiple microservices with the fleet REST API data serving 40,000 real customers.
Interactive
Prototype phase
During the interactive prototype phase, focus on optimizing interactions to thoroughly understand the site flow. Leverage the site map and site navigation to ensure the platform includes all required assets, aligns with the customer success journey, and meets business goals and requirements.